Grammar of graphics
2023-03-31
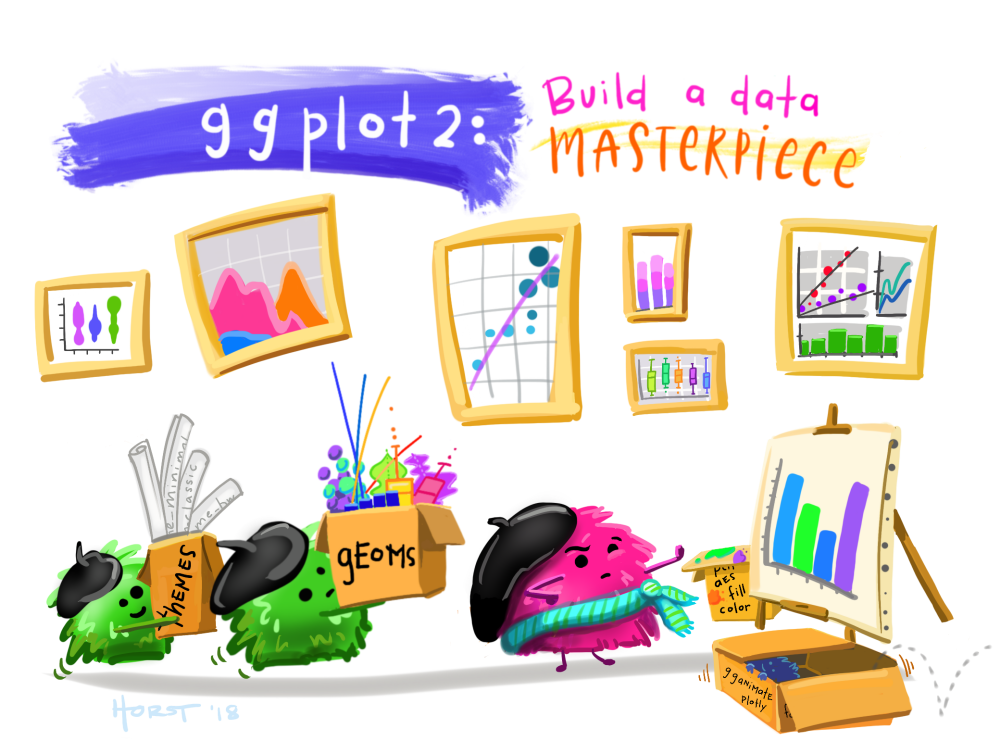
Plotting with {ggplot2}
Grammar of graphics
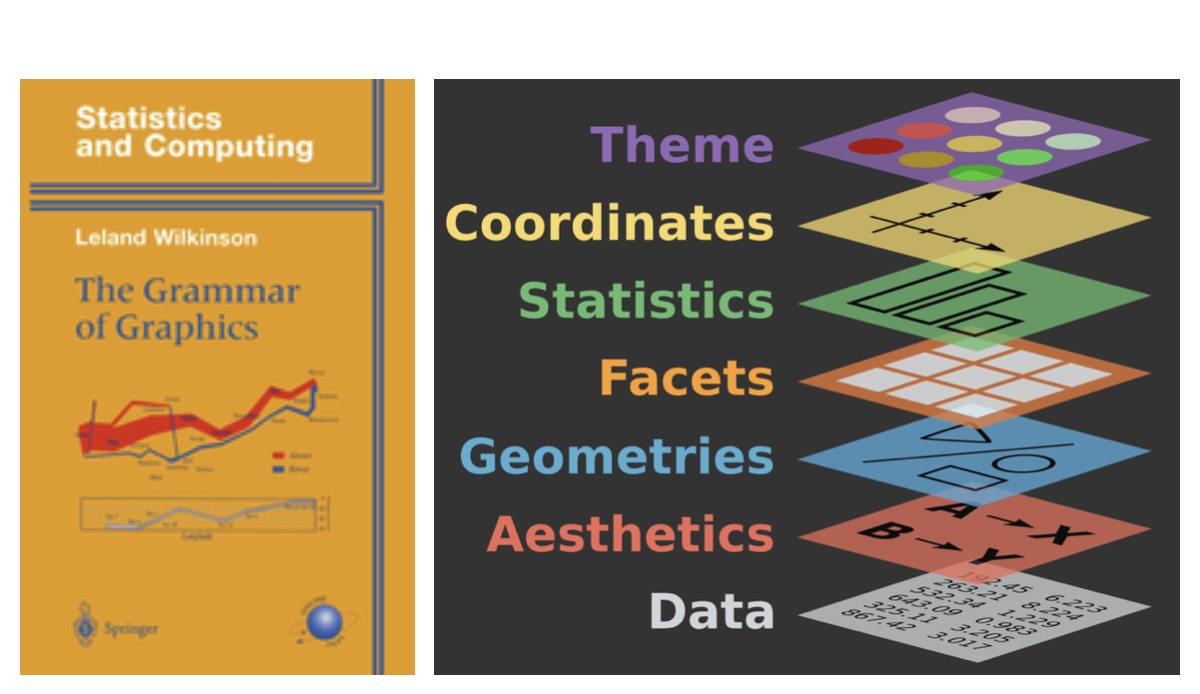
Full specification of plot
ggplot(data = penguins) +
  geom_point(
    mapping = aes(x = bill_length_mm, y = bill_depth_mm),
    stat = "identity",
    position = "identity"
  ) +
  coord_cartesian() +
  facet_null()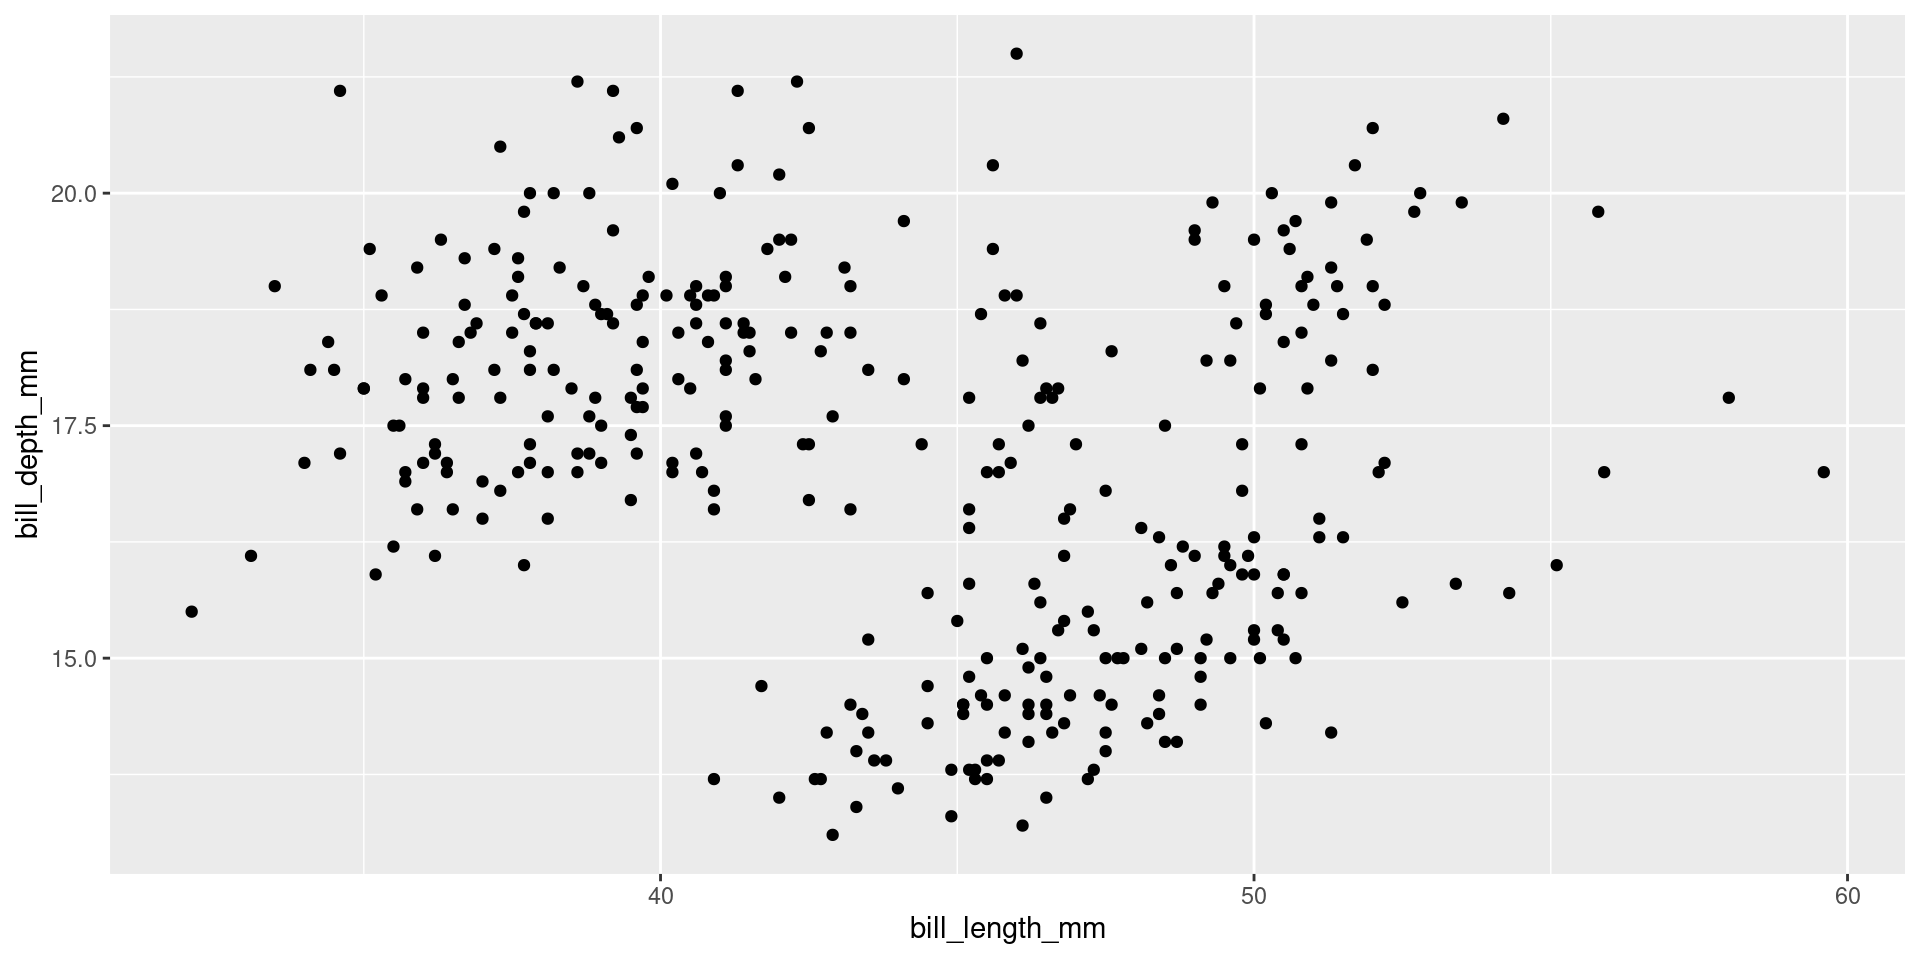
Data to ggplot
Data inside ggplot()
ggplot(data = mpg)
Data to ggplot
Data piped to ggplot()
mpg |>
  ggplot()
Data to ggplot
Process data before plotting
mpg |>
  filter(class != "2seater") |>
  mutate(class = str_to_sentence(class)) |>
  ggplot()
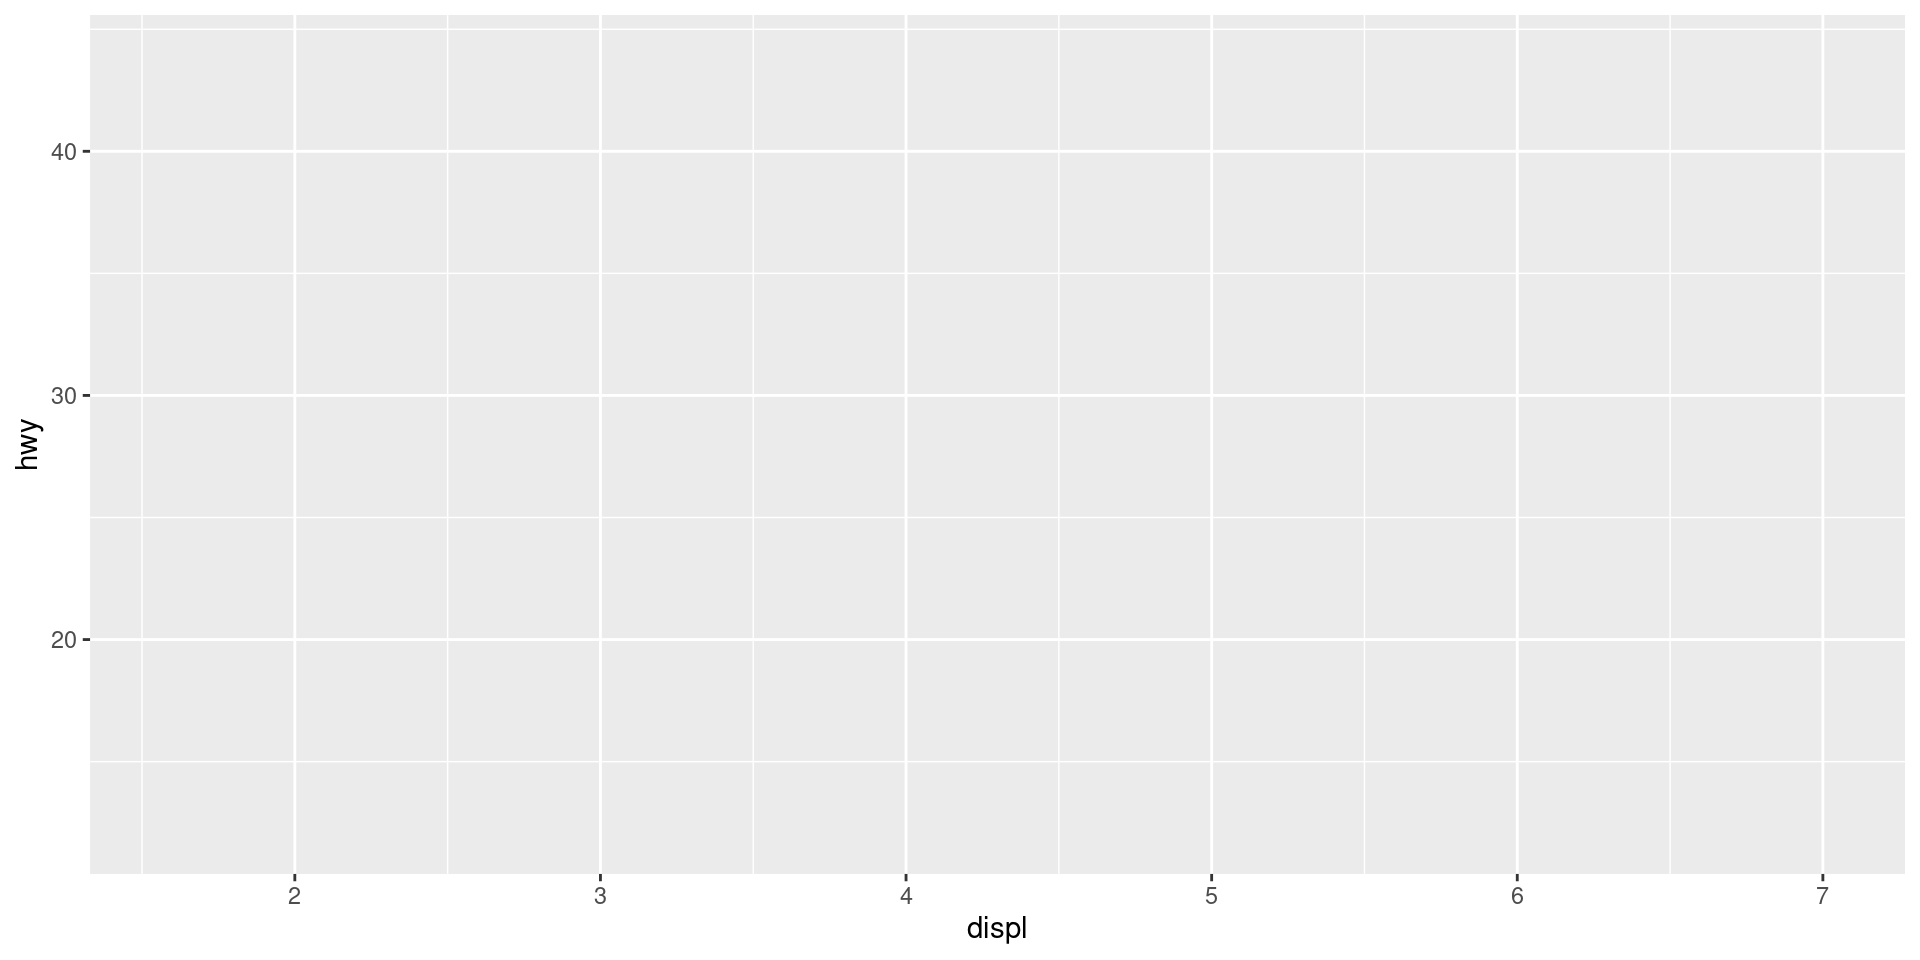
Map data to positions
Specify columns for x and y

Map data to positions
Equivalent but not ideal. Why?

Map data to positions
This is how we’ll do it
Geoms
There are many different ways of representing data on a plot

Plot points
Add geom_point()
mpg |>
ggplot(aes(x = displ, y = hwy)) +
geom_point()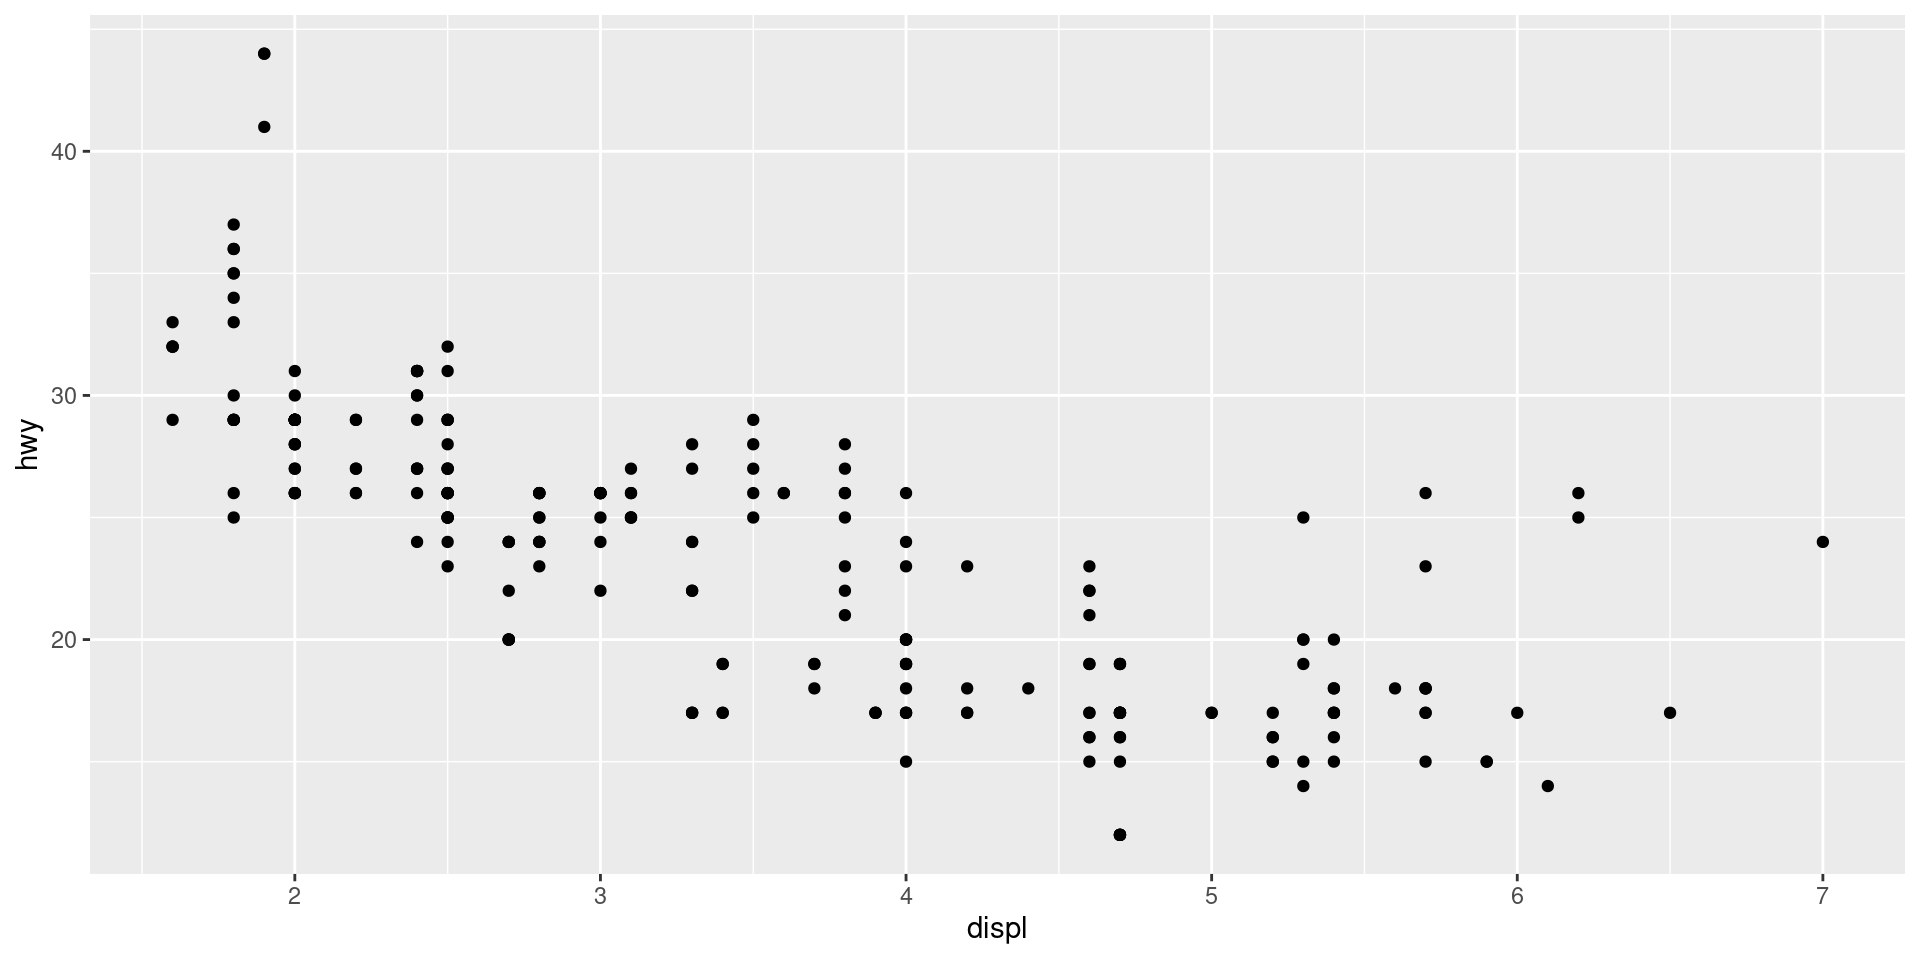
Plot points
How is this different? What are advantages/disadvantages?
mpg |>
ggplot() +
geom_point(aes(x = displ, y = hwy))
Plot smooth lines
#
mpg |>
ggplot(aes(x = displ, y = hwy)) +
geom_smooth()
Plot multiple geoms
mpg |>
  ggplot(aes(x = displ, y = hwy)) +
geom_point() +
geom_smooth()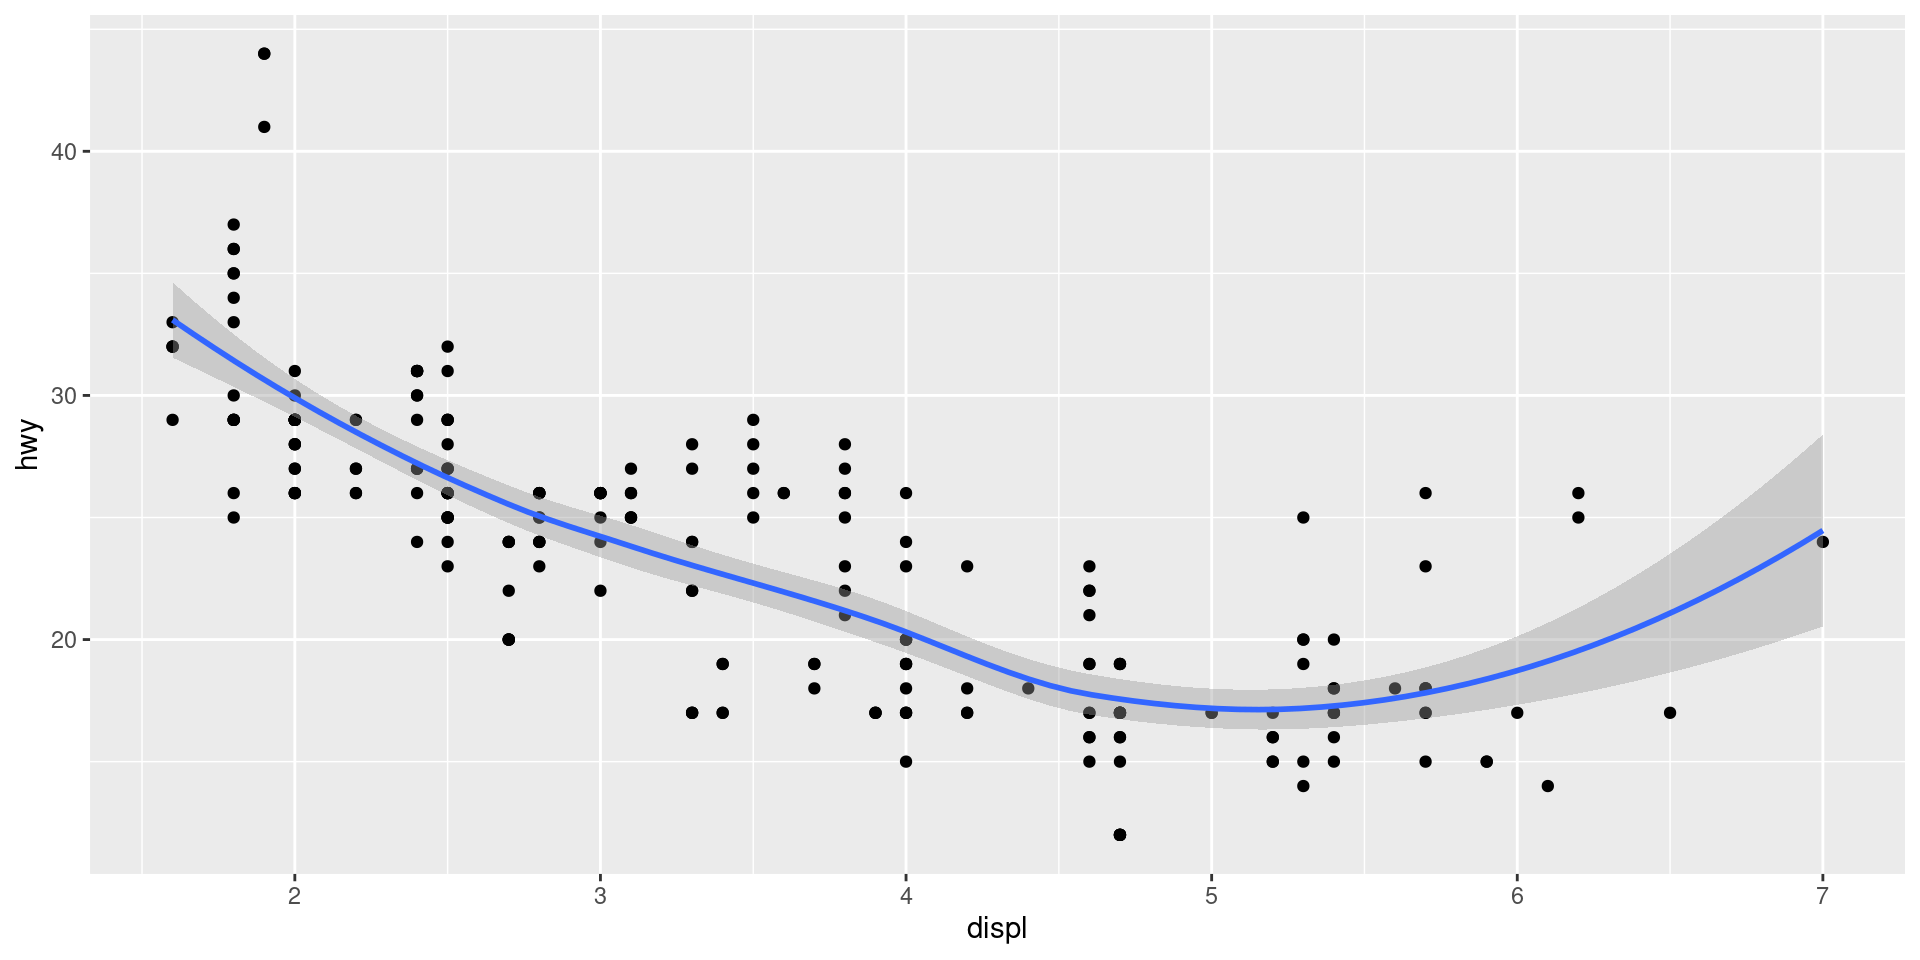
Order matters
mpg |>
  ggplot(aes(x = displ, y = hwy)) +
  geom_smooth() +
  geom_point()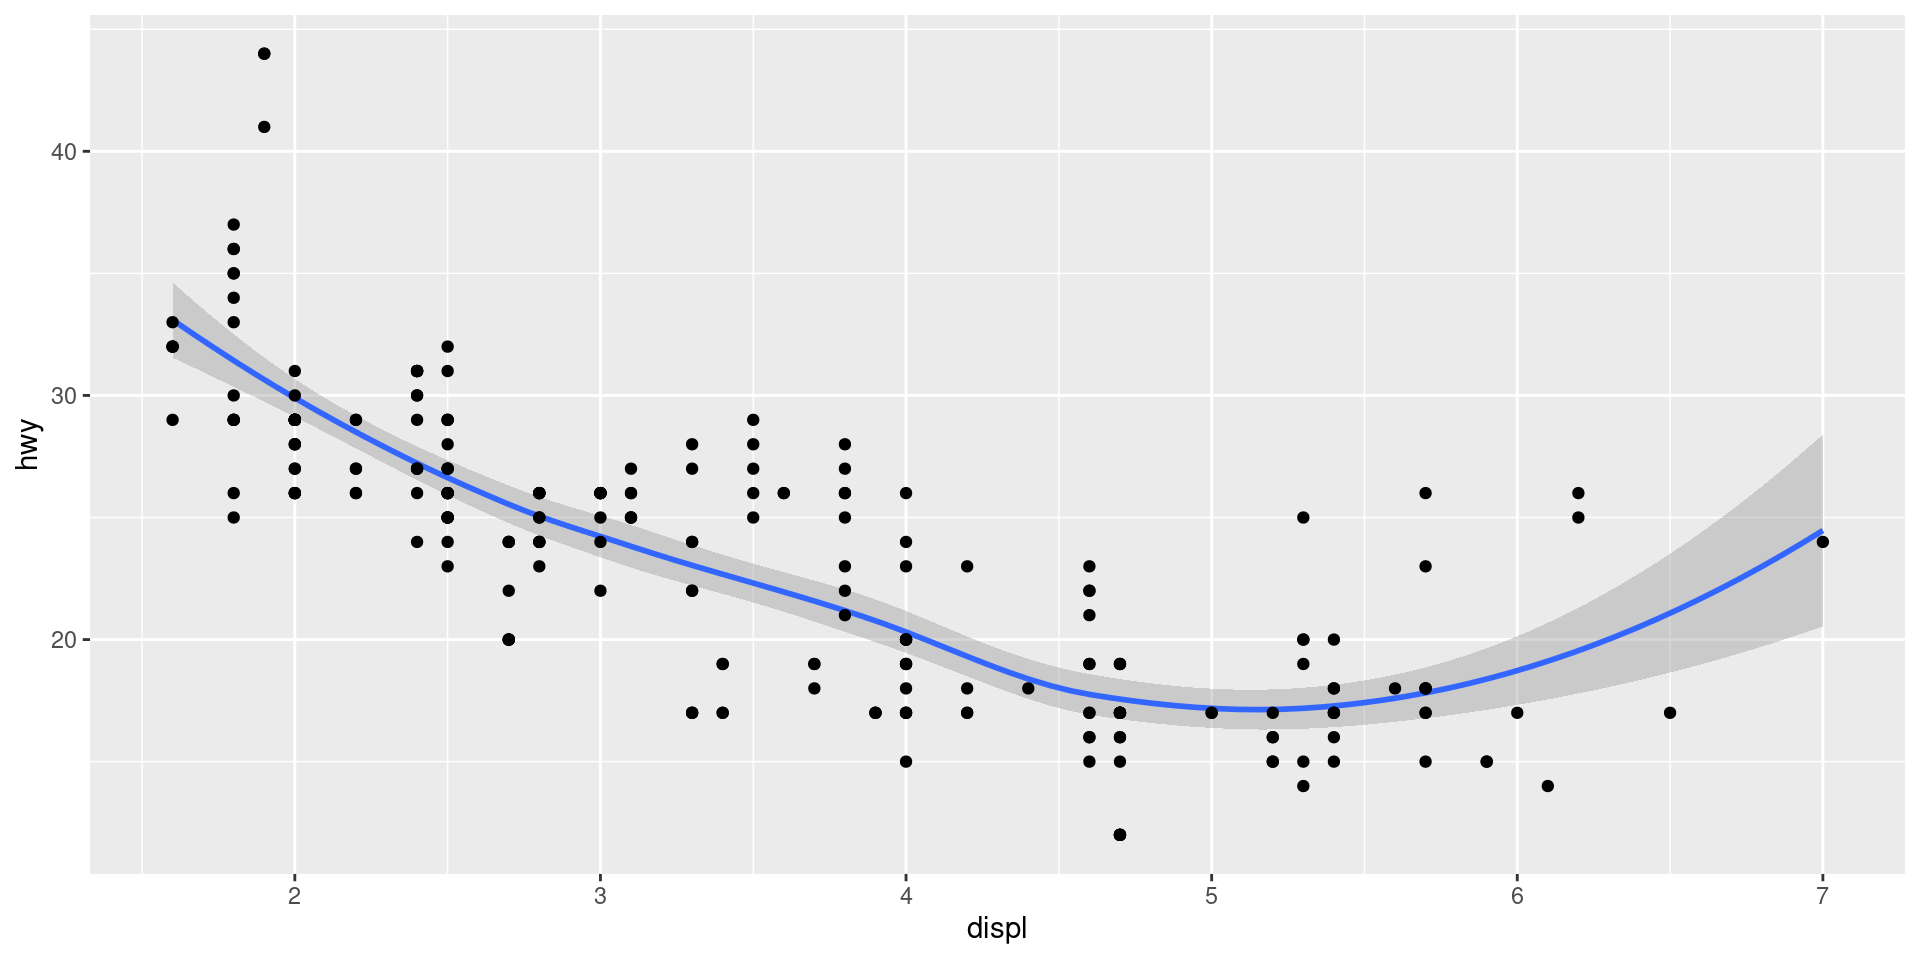
Plot linear regression line
mpg |>
  ggplot(aes(x = displ, y = hwy)) +
  geom_point() +
  geom_smooth(method = "lm")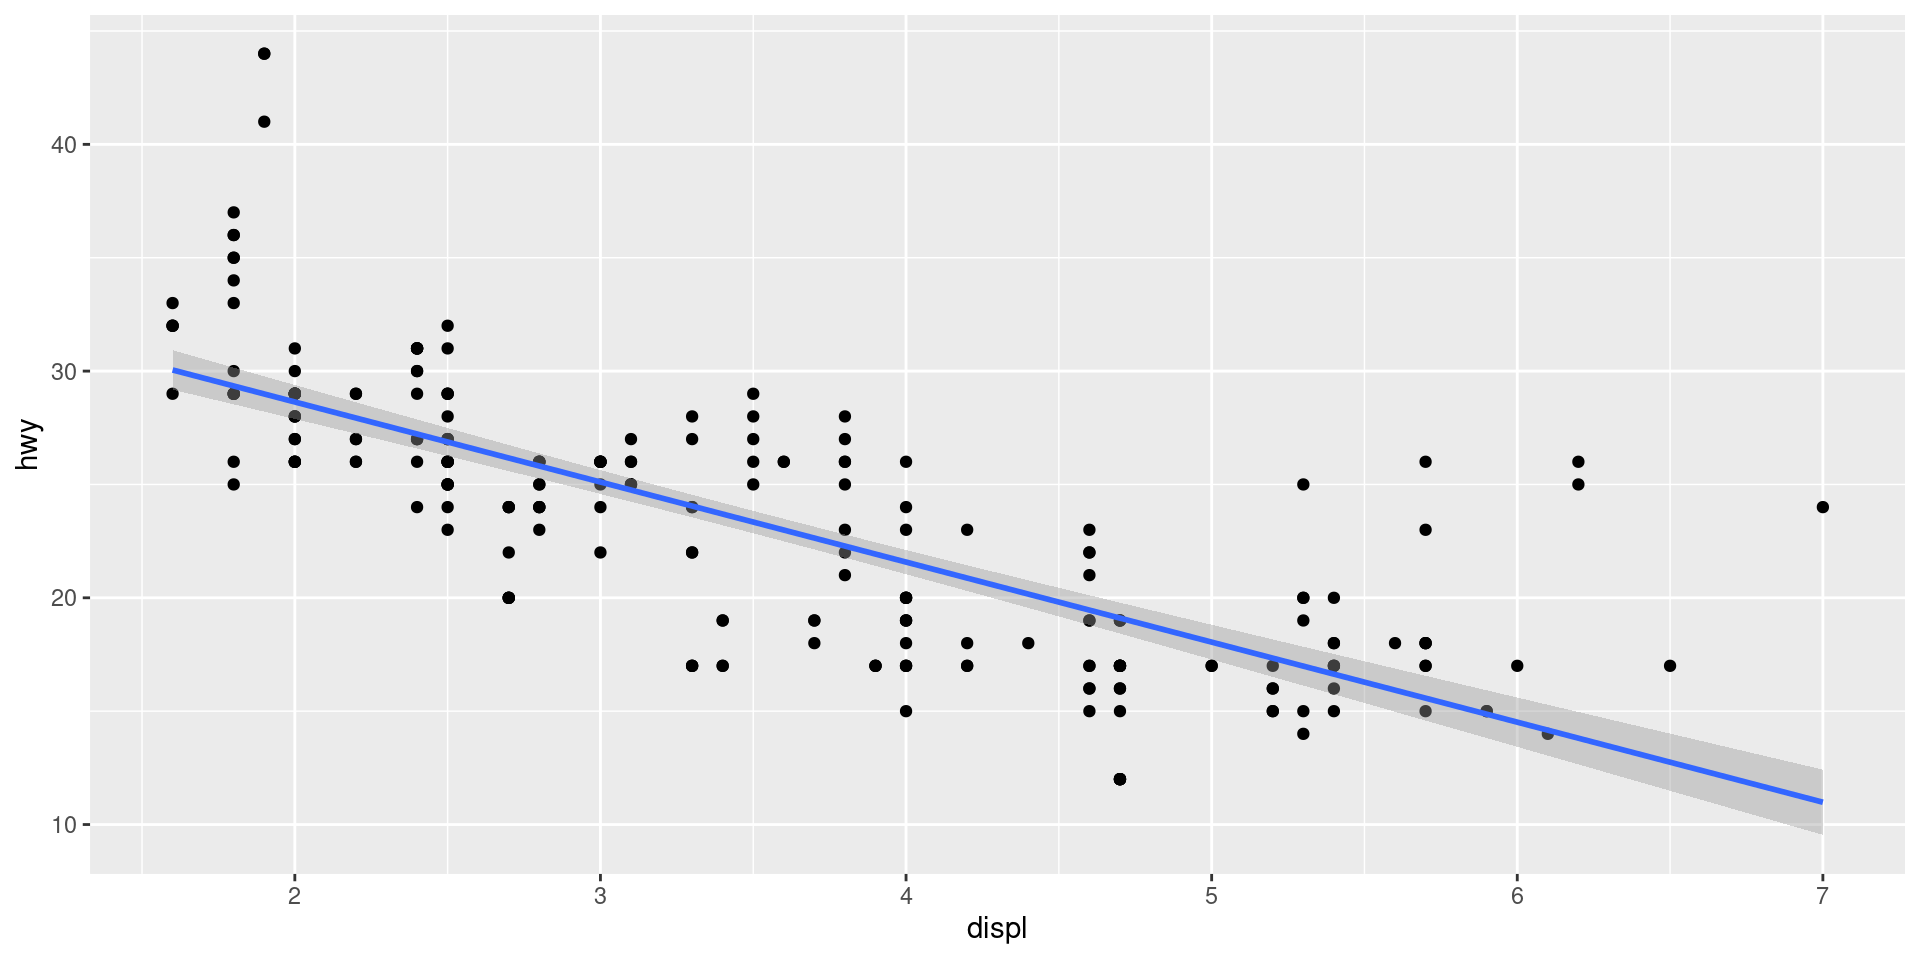
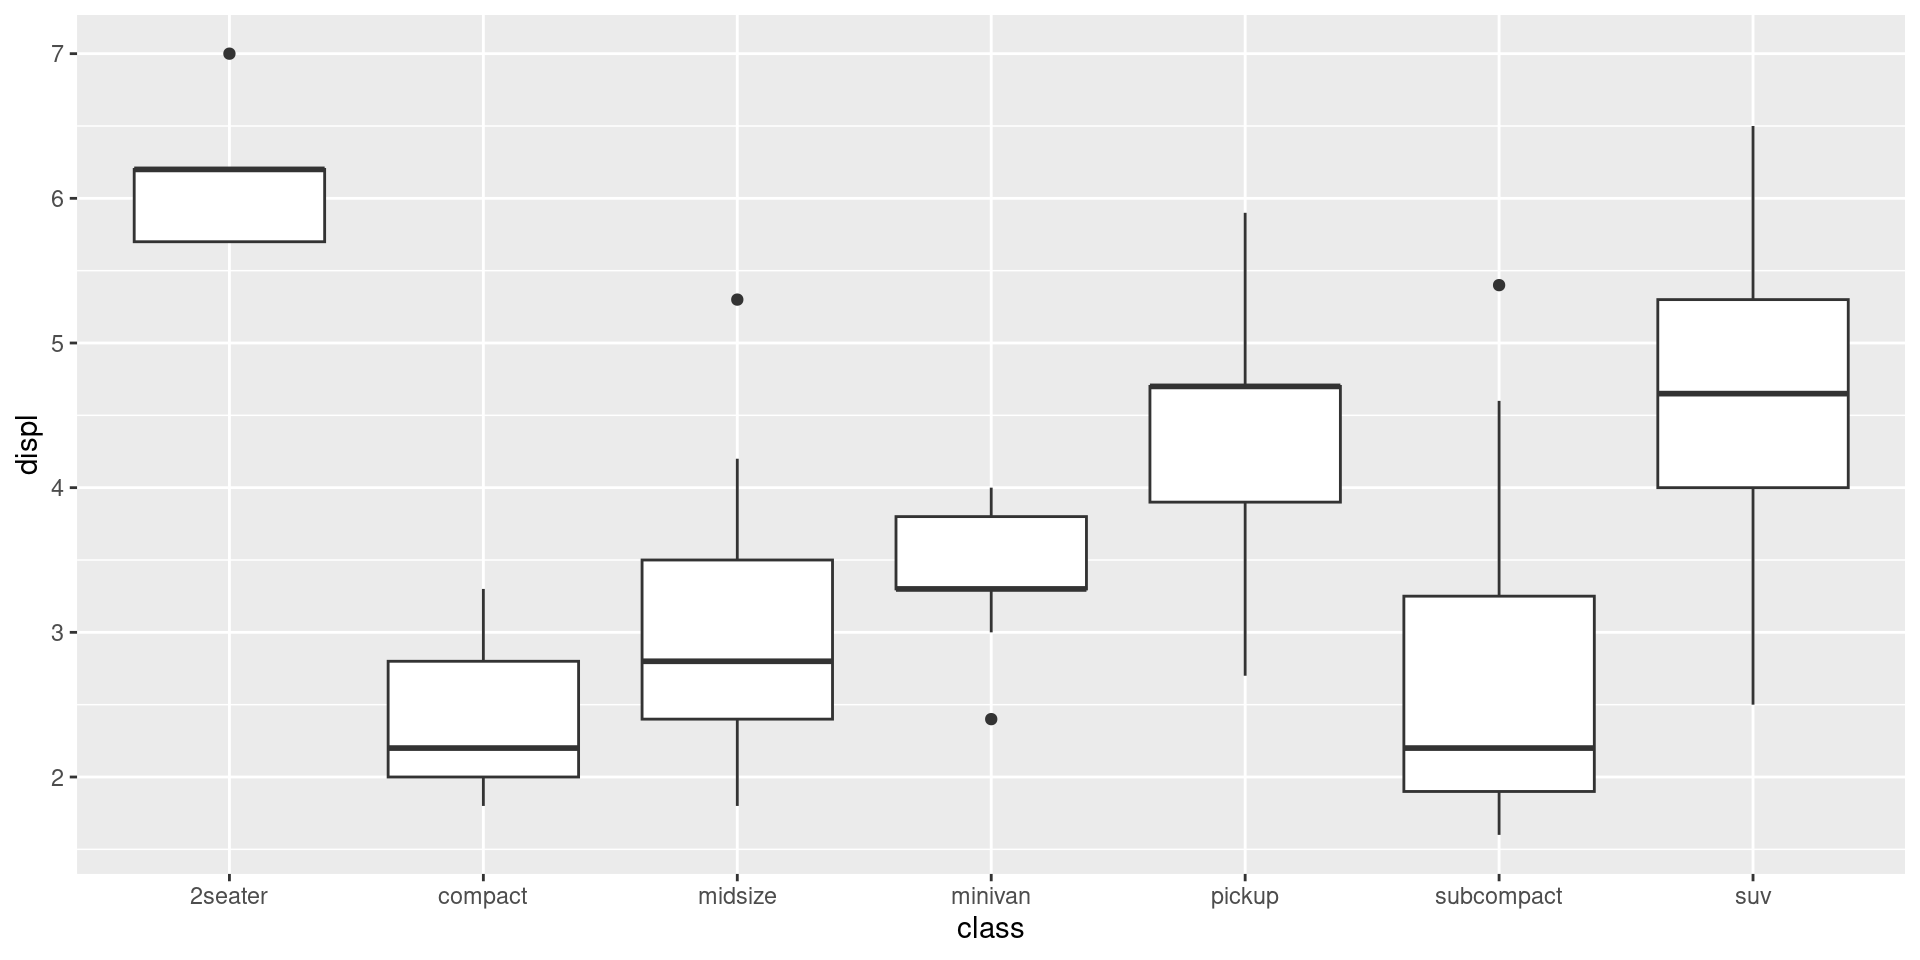
Plot boxplots
mpg |>
  ggplot(aes(x = class, y = displ)) +
  geom_boxplot()