Merging columns
Jeff Stevens
2023-03-01
Introduction
The problem
What’s different between these data sets?
What is needed to create data3 from data1 and data2?
data1# A tibble: 12 × 3
id cond resp
<int> <int> <dbl>
1 1 1 0.81
2 1 2 0.269
3 1 3 0.487
4 2 1 0.088
5 2 2 0.413
6 2 3 0.455
7 3 1 0.026
8 3 2 0.732
9 3 3 0.664
10 4 1 0.736
11 4 2 0.915
12 4 3 0.417data2# A tibble: 6 × 2
id age
<int> <int>
1 1 46
2 2 40
3 3 71
4 4 72
5 5 66
6 6 42data3# A tibble: 12 × 4
id age cond resp
<int> <int> <int> <dbl>
1 1 46 1 0.81
2 1 46 2 0.269
3 1 46 3 0.487
4 2 40 1 0.088
5 2 40 2 0.413
6 2 40 3 0.455
7 3 71 1 0.026
8 3 71 2 0.732
9 3 71 3 0.664
10 4 72 1 0.736
11 4 72 2 0.915
12 4 72 3 0.417Mental model of merging
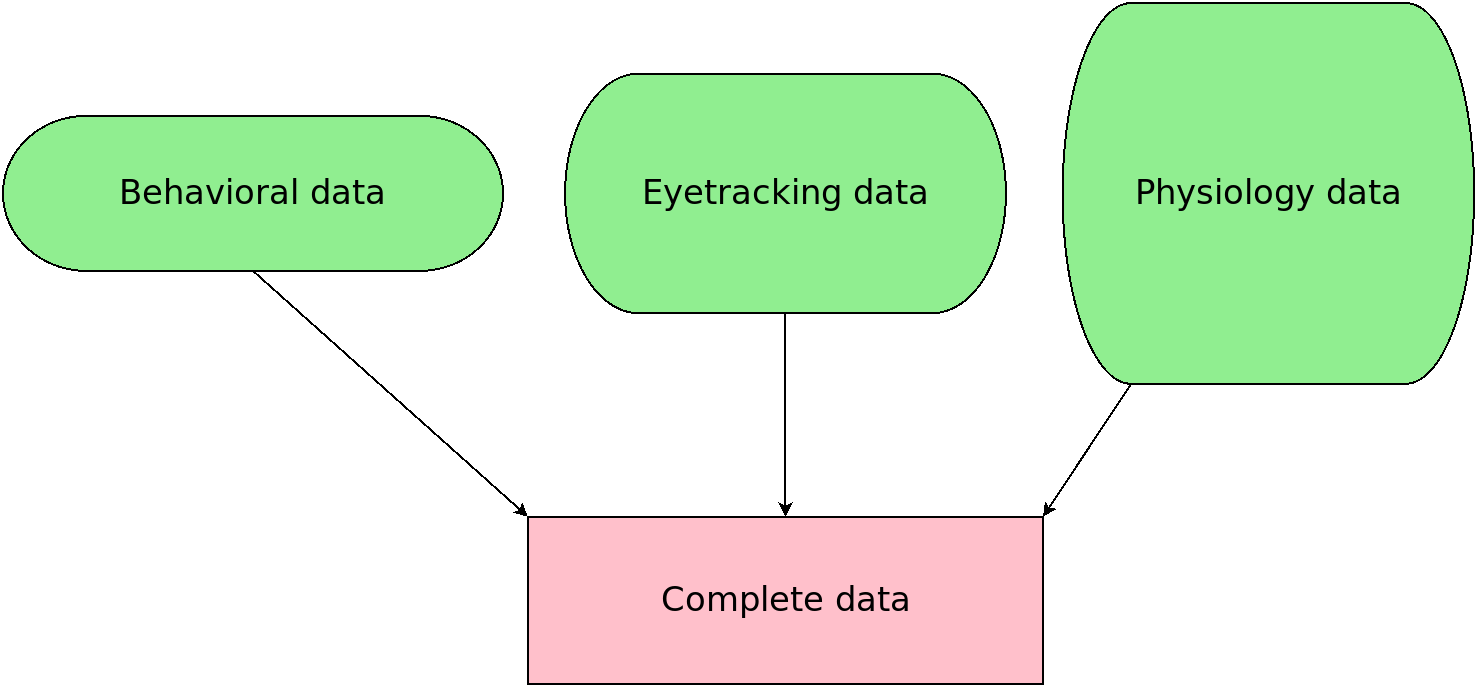
Set-up
library(dplyr)
library(nycflights13)
(flights2 <- select(flights, year:dep_time, carrier, tailnum))
# A tibble: 336,776 × 6
year month day dep_time carrier tailnum
<int> <int> <int> <int> <chr> <chr>
1 2013 1 1 517 UA N14228
2 2013 1 1 533 UA N24211
3 2013 1 1 542 AA N619AA
4 2013 1 1 544 B6 N804JB
5 2013 1 1 554 DL N668DN
6 2013 1 1 554 UA N39463
7 2013 1 1 555 B6 N516JB
8 2013 1 1 557 EV N829AS
9 2013 1 1 557 B6 N593JB
10 2013 1 1 558 AA N3ALAA
# … with 336,766 more rowsSet-up
(planes2 <- select(planes, tailnum, year, model, seats))# A tibble: 3,322 × 4
tailnum year model seats
<chr> <int> <chr> <int>
1 N10156 2004 EMB-145XR 55
2 N102UW 1998 A320-214 182
3 N103US 1999 A320-214 182
4 N104UW 1999 A320-214 182
5 N10575 2002 EMB-145LR 55
6 N105UW 1999 A320-214 182
7 N107US 1999 A320-214 182
8 N108UW 1999 A320-214 182
9 N109UW 1999 A320-214 182
10 N110UW 1999 A320-214 182
# … with 3,312 more rowsMerging data
Joining with {dplyr}
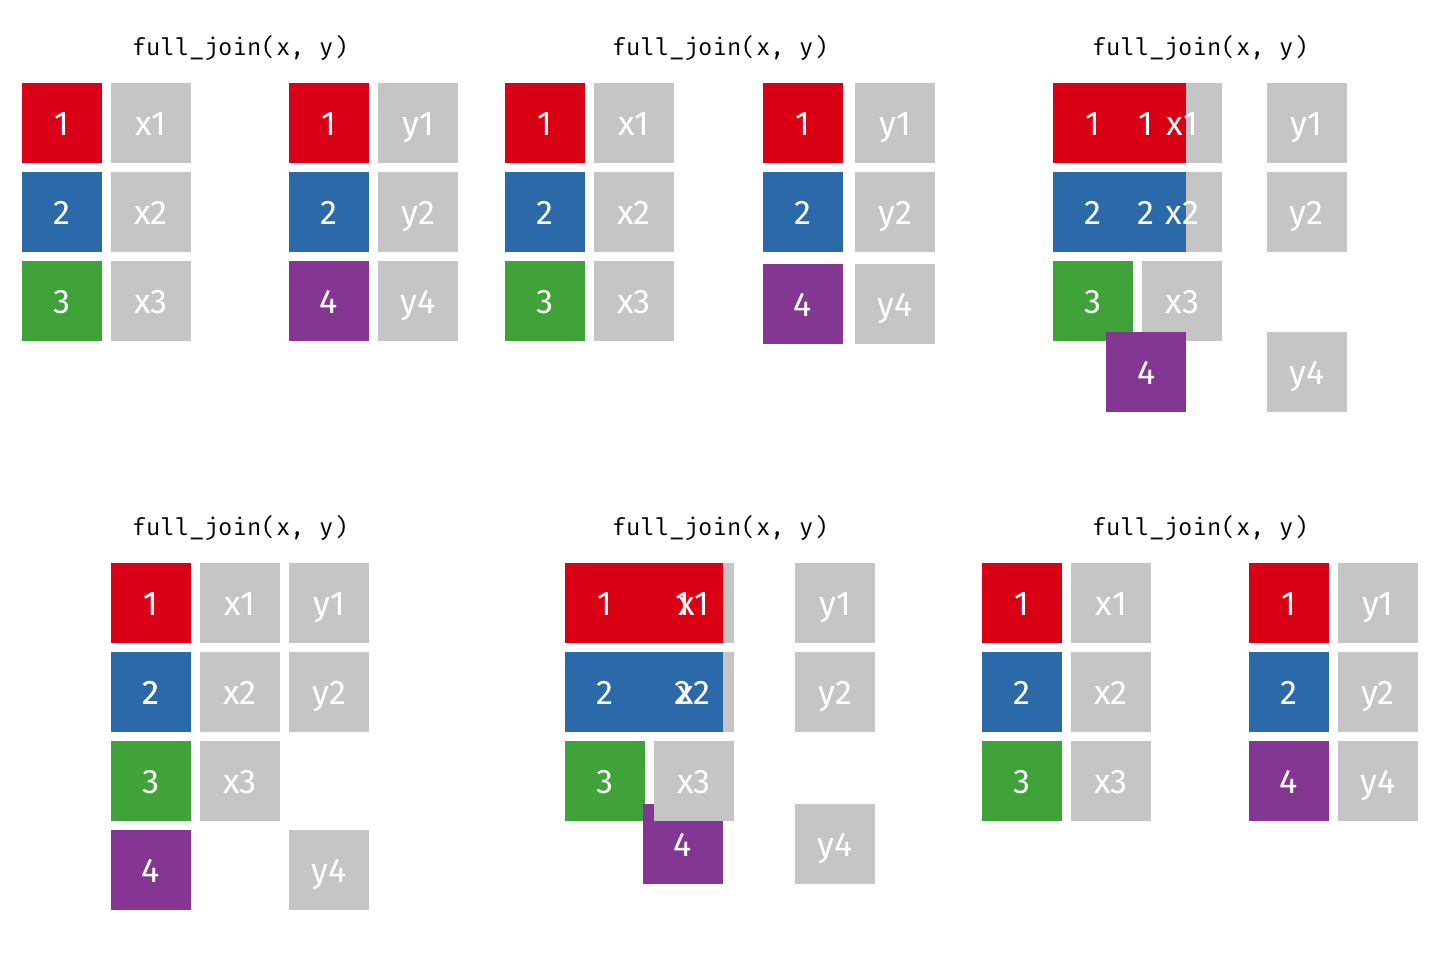

Merging data
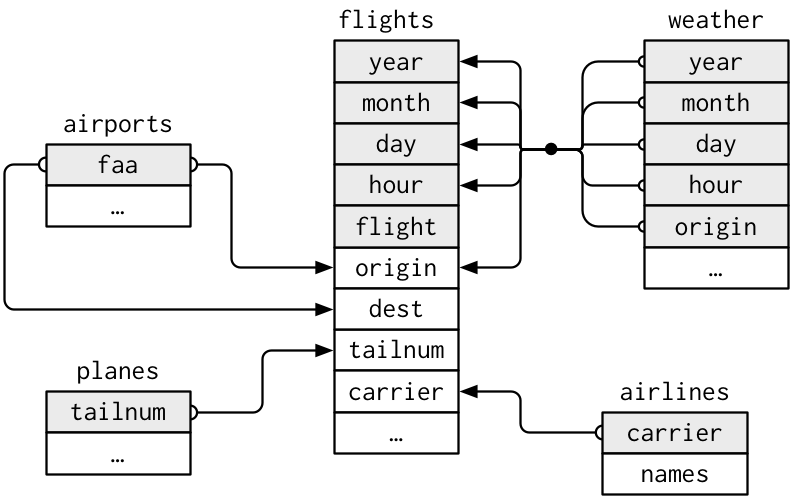
Keys
Unique identifiers of observations
Keys may take some work to clean first
Double check keys for uniqueness/duplicates
Create surrogate key if no primary key exists
Joins
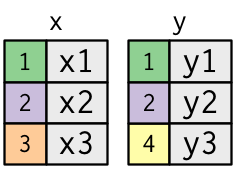
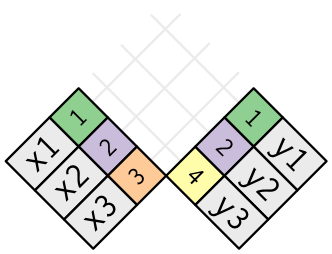
Mutating joins
Affects columns
Mutating joins
Affects columns

Inner joins
Keep only matching observations
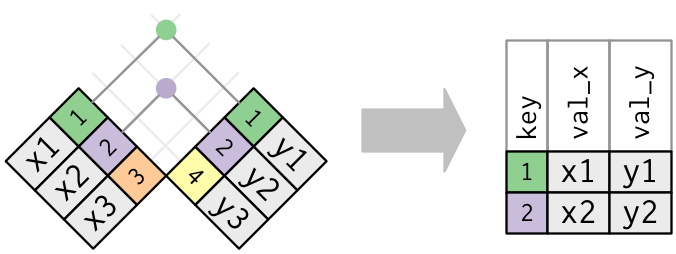
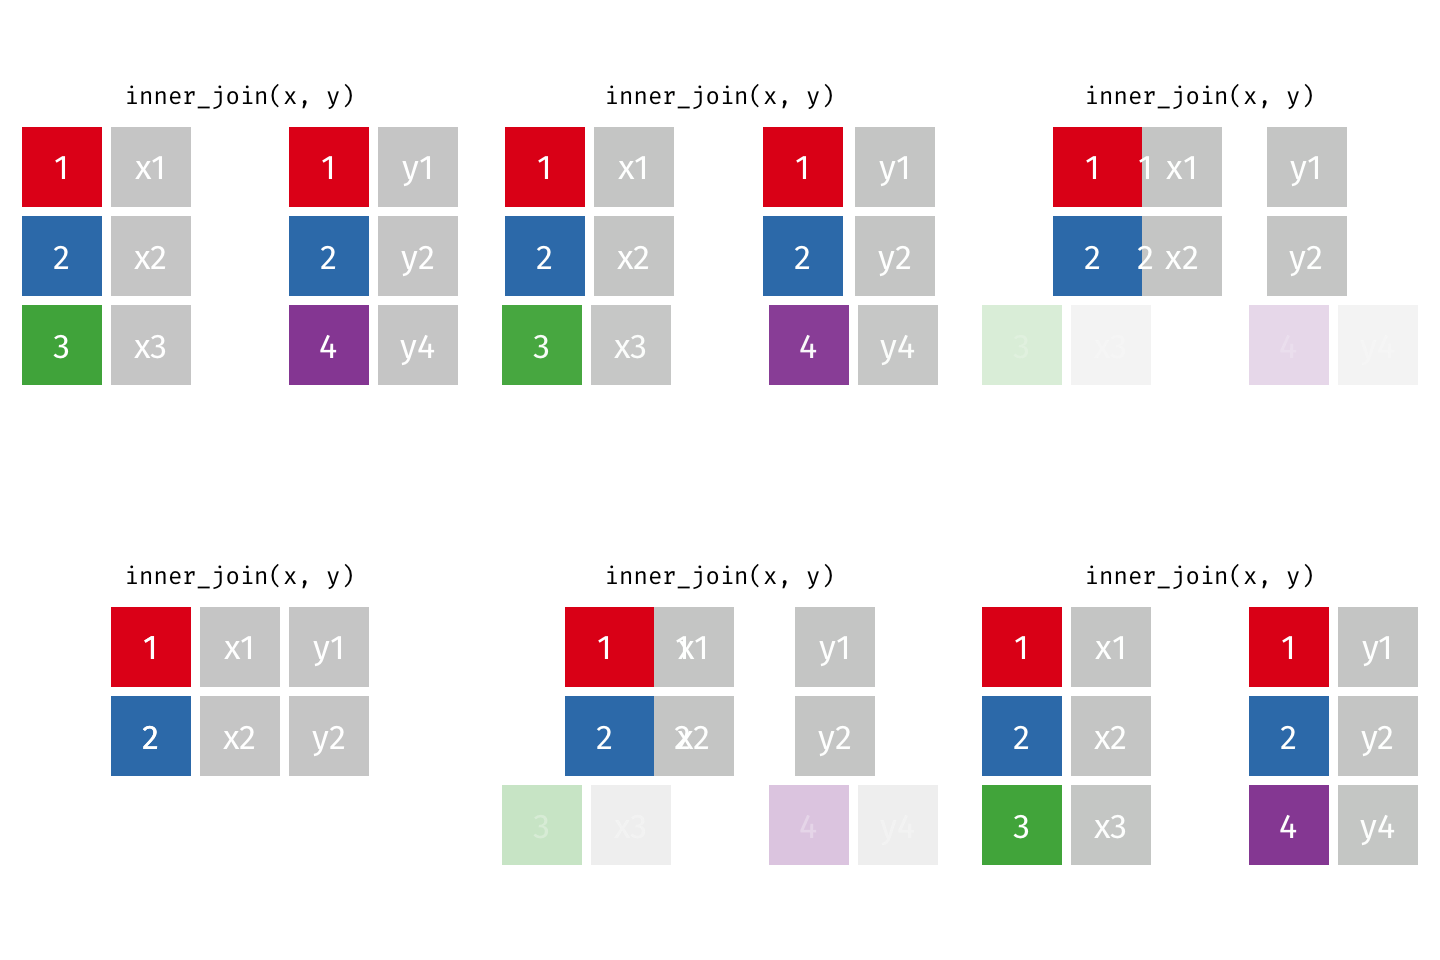
Inner joins

x# A tibble: 3 × 2
key val_x
<dbl> <chr>
1 1 x1
2 2 x2
3 3 x3 y# A tibble: 3 × 2
key val_y
<dbl> <chr>
1 1 y1
2 2 y2
3 4 y3 inner_join(x, y, by = "key")# A tibble: 2 × 3
key val_x val_y
<dbl> <chr> <chr>
1 1 x1 y1
2 2 x2 y2 x |>
inner_join(y, by = "key")# A tibble: 2 × 3
key val_x val_y
<dbl> <chr> <chr>
1 1 x1 y1
2 2 x2 y2 Inner joins
glimpse(flights2)Rows: 336,776
Columns: 6
$ year <int> 2013, 2013, 2013, 2013, 2013, 2013, 2013, 2013, 2013, 2013, 2…
$ month <int> 1, 1, 1, 1, 1, 1, 1, 1, 1, 1, 1, 1, 1, 1, 1, 1, 1, 1, 1, 1, 1…
$ day <int> 1, 1, 1, 1, 1, 1, 1, 1, 1, 1, 1, 1, 1, 1, 1, 1, 1, 1, 1, 1, 1…
$ dep_time <int> 517, 533, 542, 544, 554, 554, 555, 557, 557, 558, 558, 558, 5…
$ carrier <chr> "UA", "UA", "AA", "B6", "DL", "UA", "B6", "EV", "B6", "AA", "…
$ tailnum <chr> "N14228", "N24211", "N619AA", "N804JB", "N668DN", "N39463", "…glimpse(planes2)Rows: 3,322
Columns: 4
$ tailnum <chr> "N10156", "N102UW", "N103US", "N104UW", "N10575", "N105UW", "N…
$ year <int> 2004, 1998, 1999, 1999, 2002, 1999, 1999, 1999, 1999, 1999, 20…
$ model <chr> "EMB-145XR", "A320-214", "A320-214", "A320-214", "EMB-145LR", …
$ seats <int> 55, 182, 182, 182, 55, 182, 182, 182, 182, 182, 55, 55, 55, 55…Inner joins
flights2 |>
  inner_join(planes2, by = "tailnum")
# A tibble: 284,170 × 9
year.x month day dep_time carrier tailnum year.y model seats
<int> <int> <int> <int> <chr> <chr> <int> <chr> <int>
1 2013 1 1 517 UA N14228 1999 737-824 149
2 2013 1 1 533 UA N24211 1998 737-824 149
3 2013 1 1 542 AA N619AA 1990 757-223 178
4 2013 1 1 544 B6 N804JB 2012 A320-232 200
5 2013 1 1 554 DL N668DN 1991 757-232 178
6 2013 1 1 554 UA N39463 2012 737-924ER 191
7 2013 1 1 555 B6 N516JB 2000 A320-232 200
8 2013 1 1 557 EV N829AS 1998 CL-600-2B19 55
9 2013 1 1 557 B6 N593JB 2004 A320-232 200
10 2013 1 1 558 B6 N793JB 2011 A320-232 200
# … with 284,160 more rowsWhat do you notice about the result?
Inner joins
Warning
Only use inner joins when you want the intersection of the two data sets!

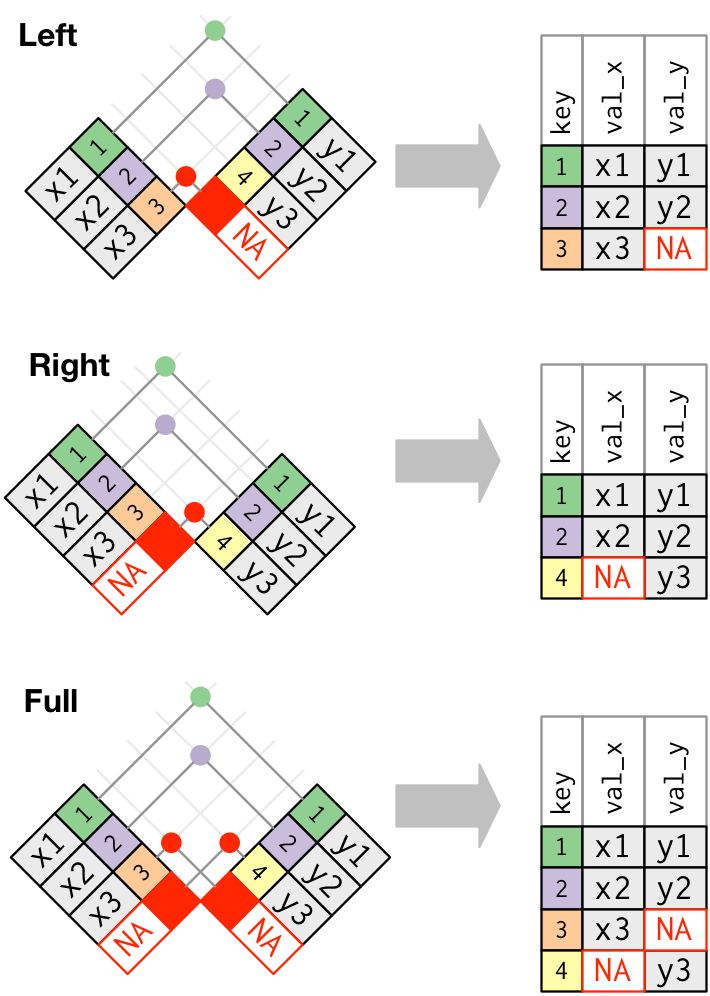
Outer joins
Keep observations that appear in at least one of the tables
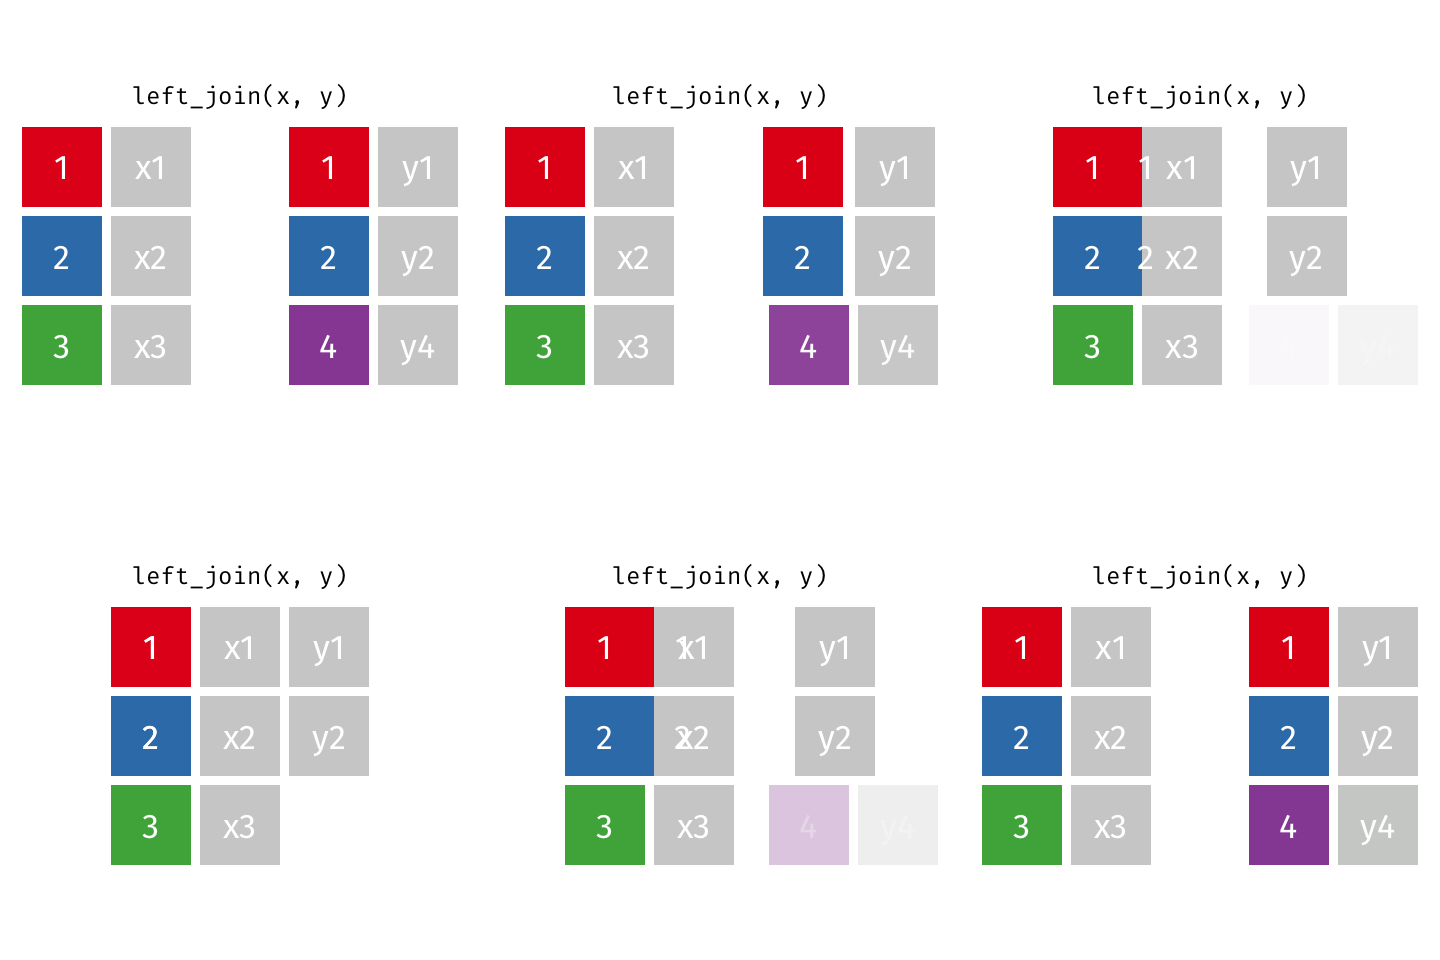
Left
Right
Full
Left joins
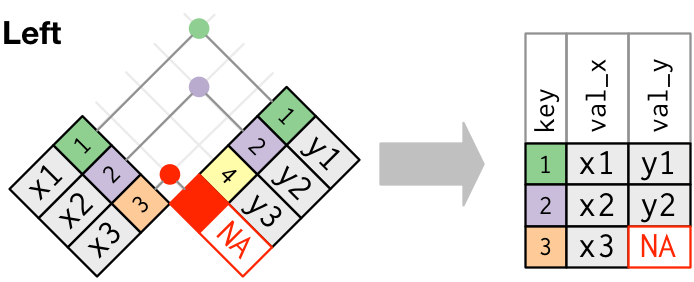
Keep only left observations

Left joins

x# A tibble: 3 × 2
key val_x
<dbl> <chr>
1 1 x1
2 2 x2
3 3 x3 y# A tibble: 3 × 2
key val_y
<dbl> <chr>
1 1 y1
2 2 y2
3 4 y3 left_join(x, y, by = "key")# A tibble: 3 × 3
key val_x val_y
<dbl> <chr> <chr>
1 1 x1 y1
2 2 x2 y2
3 3 x3 <NA> Left joins
head(flights2)# A tibble: 6 × 6
year month day dep_time carrier tailnum
<int> <int> <int> <int> <chr> <chr>
1 2013 1 1 517 UA N14228
2 2013 1 1 533 UA N24211
3 2013 1 1 542 AA N619AA
4 2013 1 1 544 B6 N804JB
5 2013 1 1 554 DL N668DN
6 2013 1 1 554 UA N39463 head(planes2)# A tibble: 6 × 4
tailnum year model seats
<chr> <int> <chr> <int>
1 N10156 2004 EMB-145XR 55
2 N102UW 1998 A320-214 182
3 N103US 1999 A320-214 182
4 N104UW 1999 A320-214 182
5 N10575 2002 EMB-145LR 55
6 N105UW 1999 A320-214 182Left joins
flights2 |>
  left_join(planes2, by = "tailnum")
# A tibble: 336,776 × 9
year.x month day dep_time carrier tailnum year.y model seats
<int> <int> <int> <int> <chr> <chr> <int> <chr> <int>
1 2013 1 1 517 UA N14228 1999 737-824 149
2 2013 1 1 533 UA N24211 1998 737-824 149
3 2013 1 1 542 AA N619AA 1990 757-223 178
4 2013 1 1 544 B6 N804JB 2012 A320-232 200
5 2013 1 1 554 DL N668DN 1991 757-232 178
6 2013 1 1 554 UA N39463 2012 737-924ER 191
7 2013 1 1 555 B6 N516JB 2000 A320-232 200
8 2013 1 1 557 EV N829AS 1998 CL-600-2B19 55
9 2013 1 1 557 B6 N593JB 2004 A320-232 200
10 2013 1 1 558 AA N3ALAA NA <NA> NA
# … with 336,766 more rowsWarning
Select columns used to join with argument by
Inner joins
Otherwise, it uses all shared columns, which may be wrong
flights2 |>
  left_join(planes2)
# A tibble: 336,776 × 8
year month day dep_time carrier tailnum model seats
<int> <int> <int> <int> <chr> <chr> <chr> <int>
1 2013 1 1 517 UA N14228 <NA> NA
2 2013 1 1 533 UA N24211 <NA> NA
3 2013 1 1 542 AA N619AA <NA> NA
4 2013 1 1 544 B6 N804JB <NA> NA
5 2013 1 1 554 DL N668DN <NA> NA
6 2013 1 1 554 UA N39463 <NA> NA
7 2013 1 1 555 B6 N516JB <NA> NA
8 2013 1 1 557 EV N829AS <NA> NA
9 2013 1 1 557 B6 N593JB <NA> NA
10 2013 1 1 558 AA N3ALAA <NA> NA
# … with 336,766 more rowsRight joins
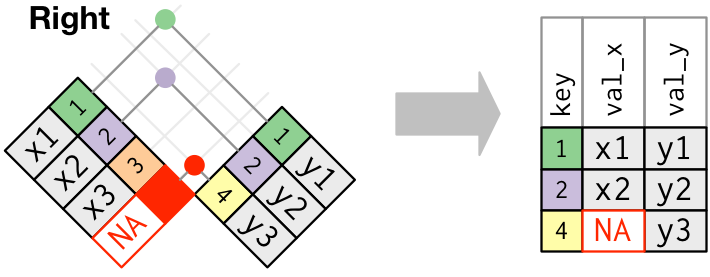
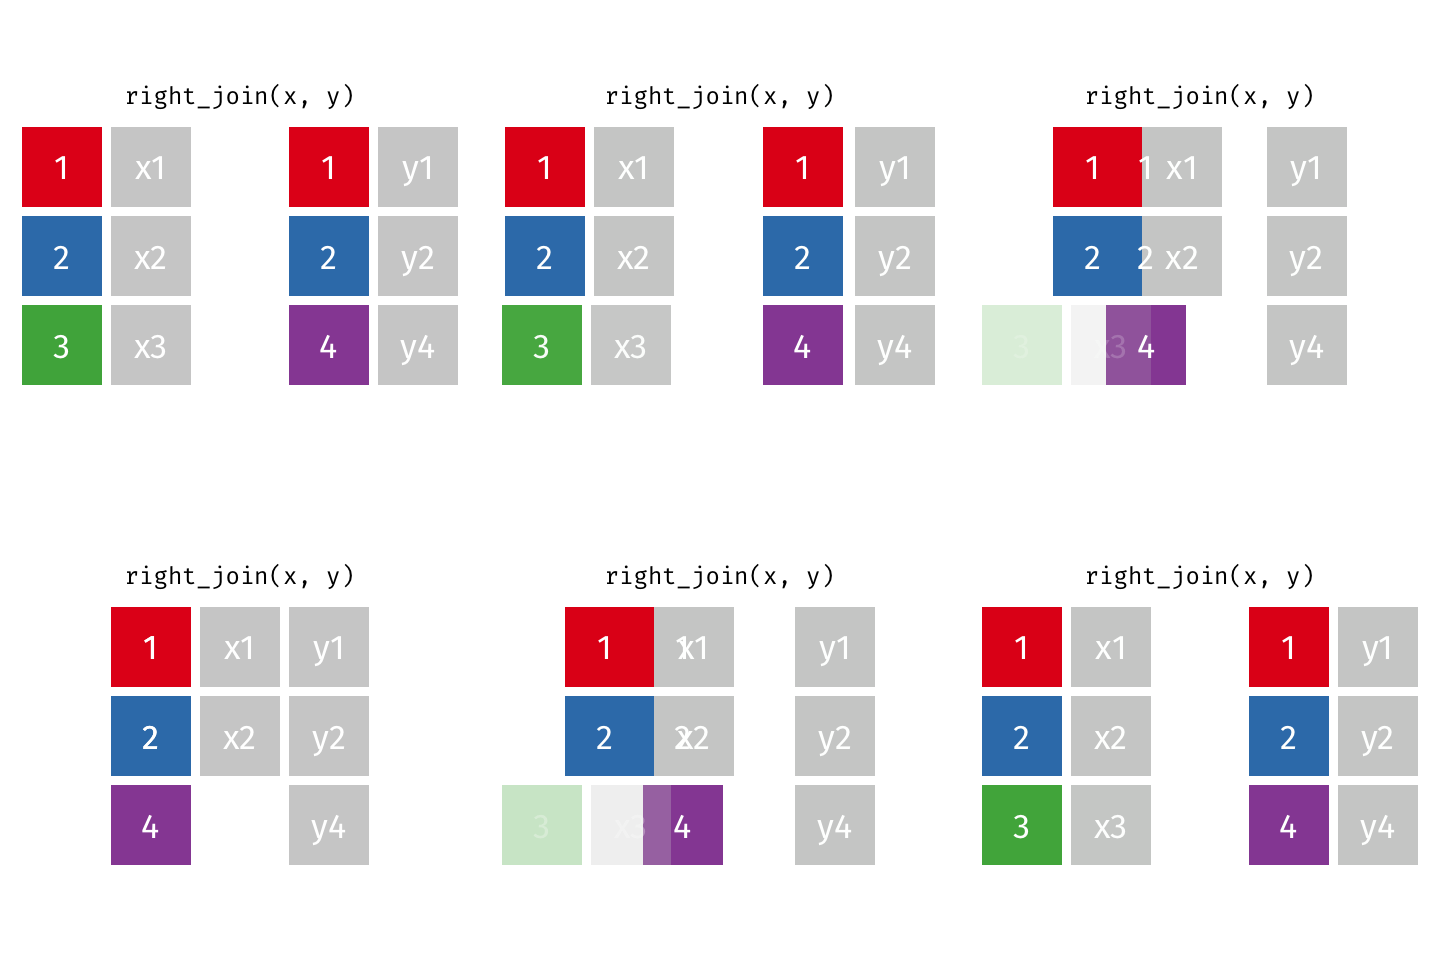
Keep only right observations
Right joins

x# A tibble: 3 × 2
key val_x
<dbl> <chr>
1 1 x1
2 2 x2
3 3 x3 y# A tibble: 3 × 2
key val_y
<dbl> <chr>
1 1 y1
2 2 y2
3 4 y3 right_join(x, y, by = "key")# A tibble: 3 × 3
key val_x val_y
<dbl> <chr> <chr>
1 1 x1 y1
2 2 x2 y2
3 4 <NA> y3 Full joins
Keep all observations
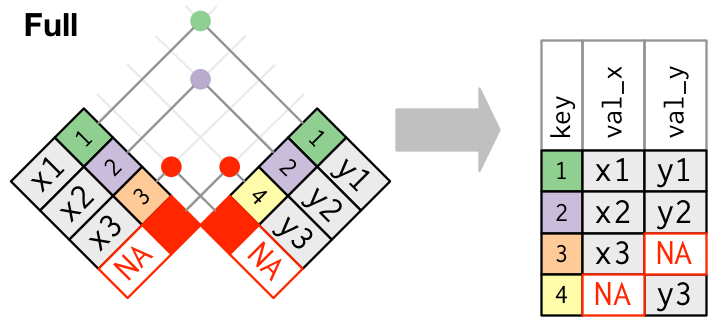

Full joins

x# A tibble: 3 × 2
key val_x
<dbl> <chr>
1 1 x1
2 2 x2
3 3 x3 y# A tibble: 3 × 2
key val_y
<dbl> <chr>
1 1 y1
2 2 y2
3 4 y3 full_join(x, y, by = "key")# A tibble: 4 × 3
key val_x val_y
<dbl> <chr> <chr>
1 1 x1 y1
2 2 x2 y2
3 3 x3 <NA>
4 4 <NA> y3 Solving the problem
What code combines data1 and data2 into data3?
data1# A tibble: 12 × 3
id cond resp
<int> <int> <dbl>
1 1 1 0.81
2 1 2 0.269
3 1 3 0.487
4 2 1 0.088
5 2 2 0.413
6 2 3 0.455
7 3 1 0.026
8 3 2 0.732
9 3 3 0.664
10 4 1 0.736
11 4 2 0.915
12 4 3 0.417data2# A tibble: 6 × 2
id age
<int> <int>
1 1 46
2 2 40
3 3 71
4 4 72
5 5 66
6 6 42data3# A tibble: 12 × 4
id age cond resp
<int> <int> <int> <dbl>
1 1 46 1 0.81
2 1 46 2 0.269
3 1 46 3 0.487
4 2 40 1 0.088
5 2 40 2 0.413
6 2 40 3 0.455
7 3 71 1 0.026
8 3 71 2 0.732
9 3 71 3 0.664
10 4 72 1 0.736
11 4 72 2 0.915
12 4 72 3 0.417