Pivoting data
2023-02-24
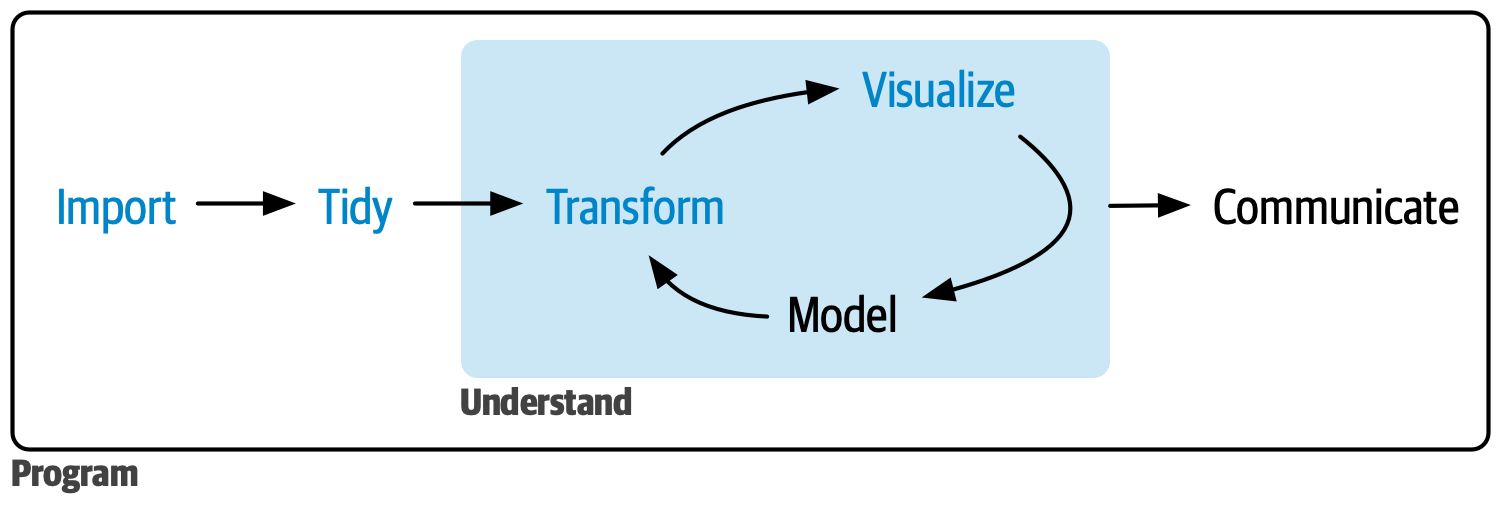
Mental model of data analysis
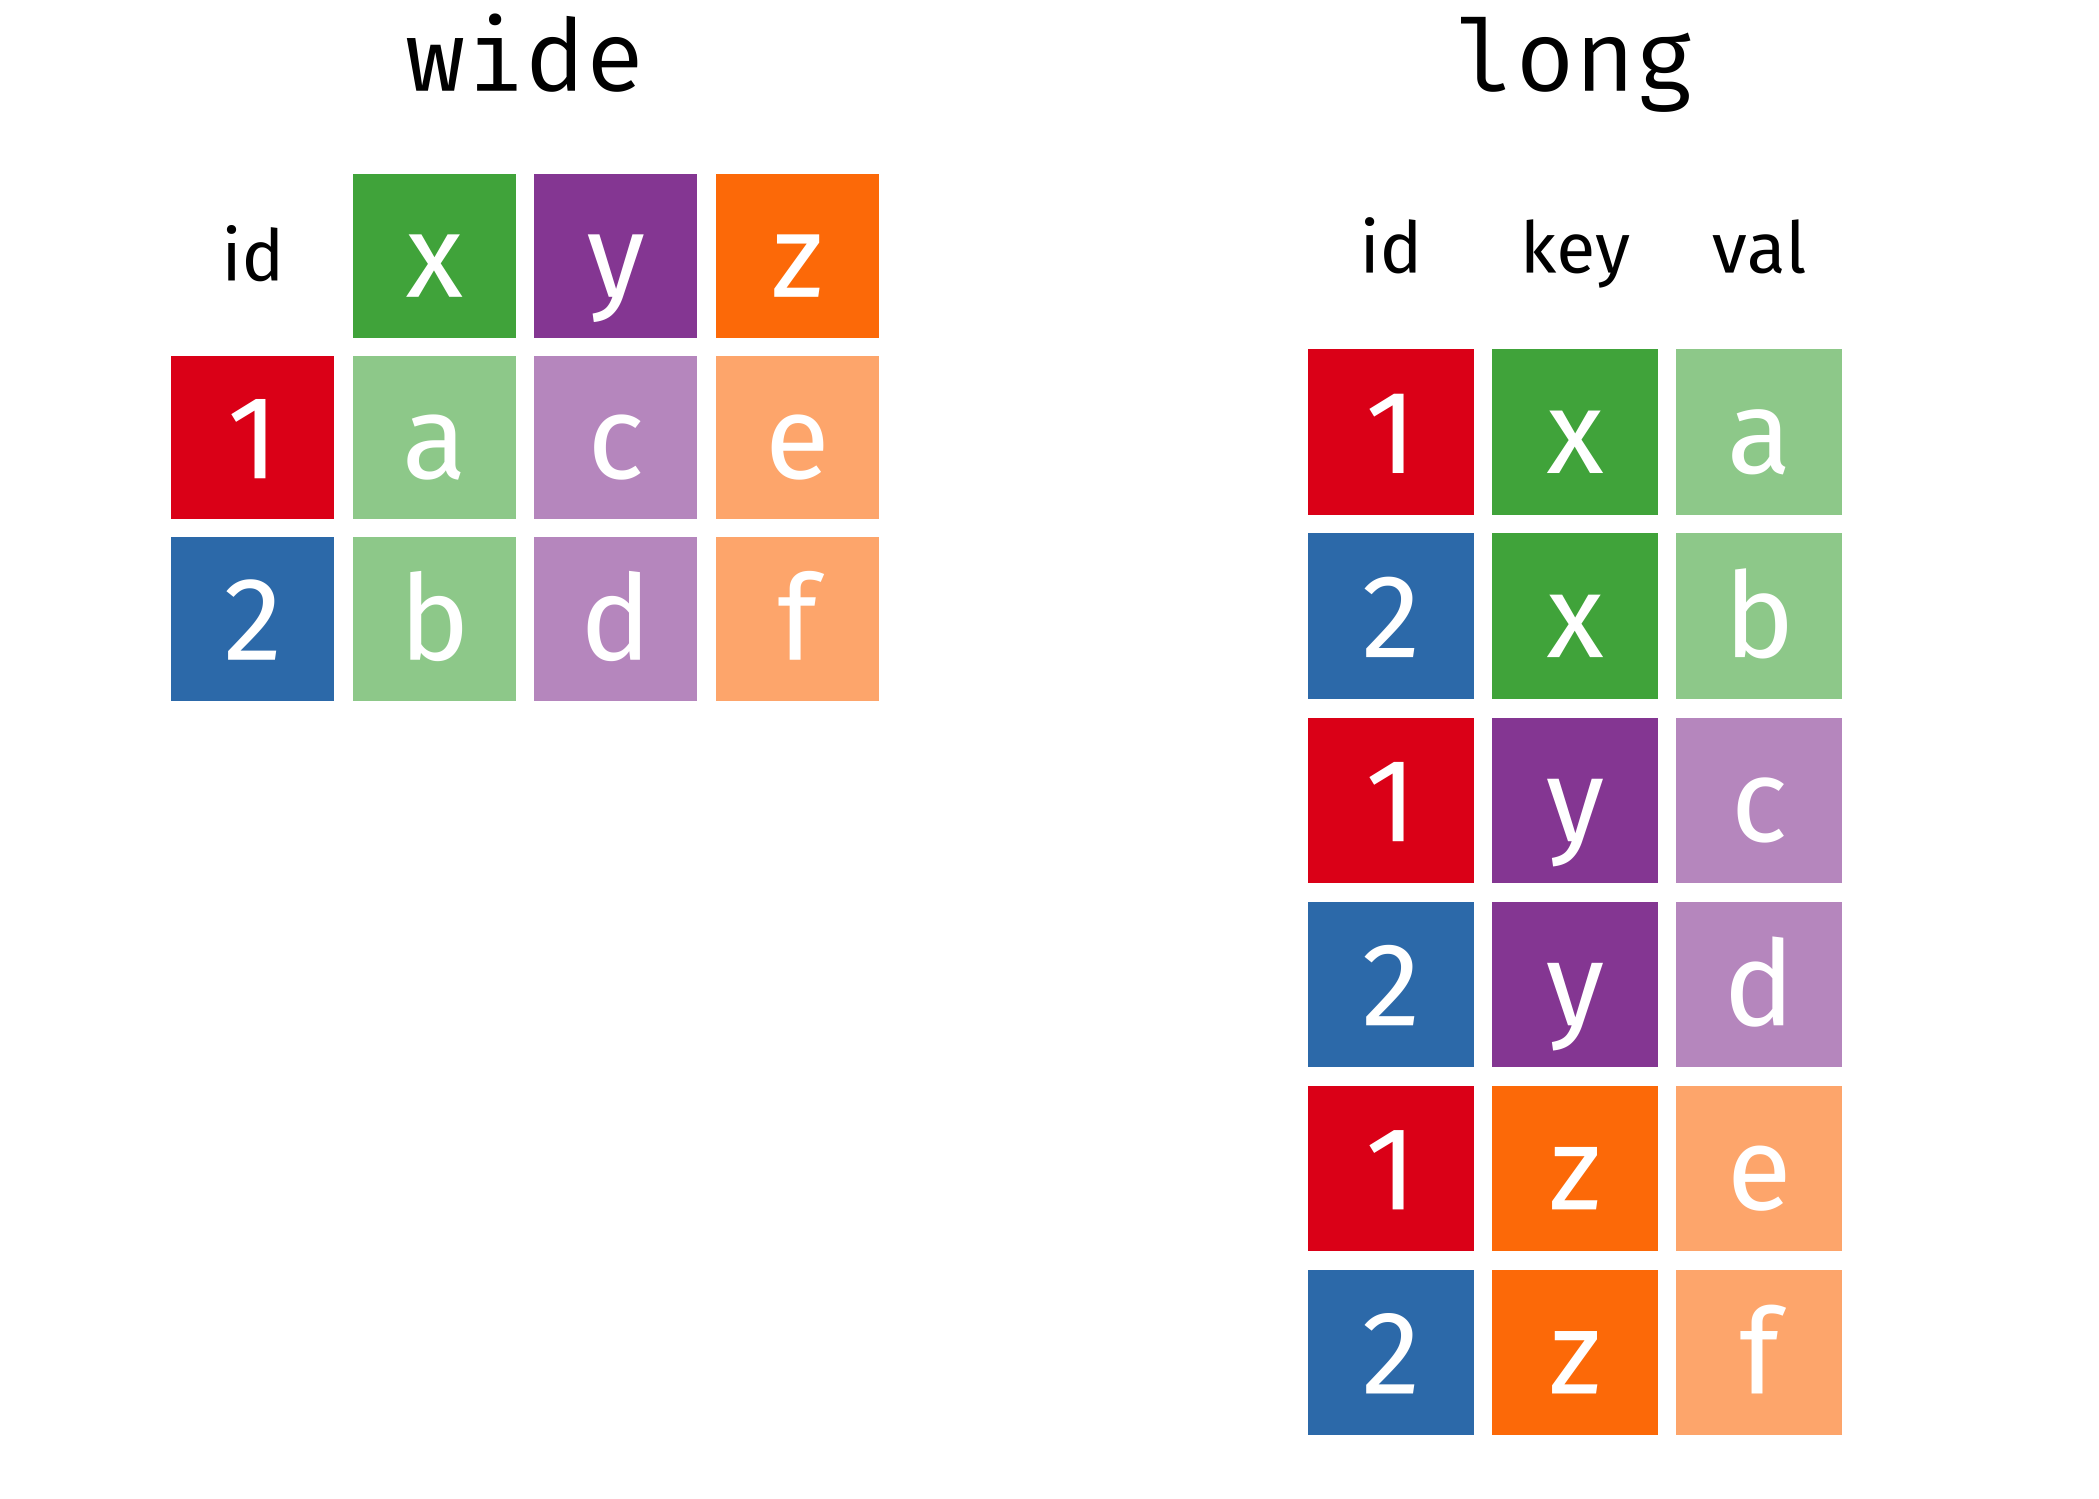
Mental model of tidy data

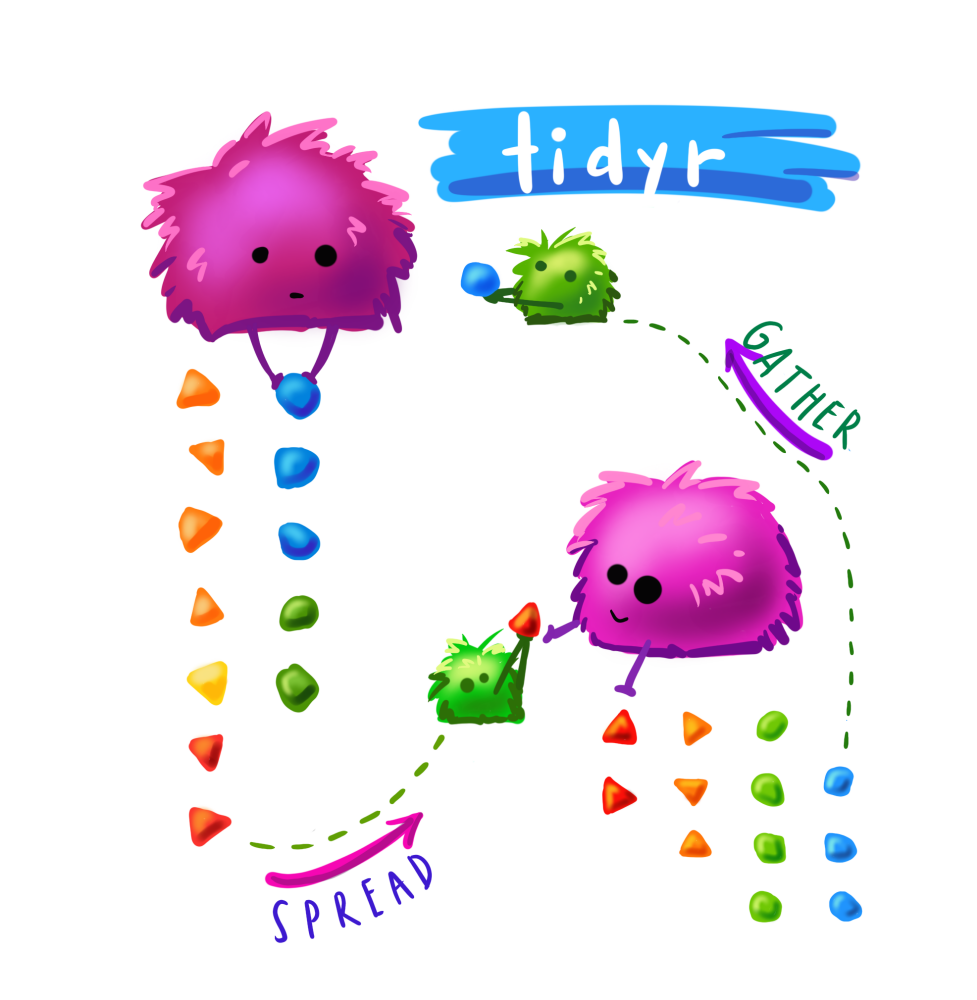
Tidying data with {tidyr} and {dplyr}

What is tidy data?
Each variable has its own column
Each observation has its own row
Each value has its own cell

Pivoting data
Pivoting data
Wide data
table4a# A tibble: 3 × 3
country `1999` `2000`
<chr> <dbl> <dbl>
1 Afghanistan 745 2666
2 Brazil 37737 80488
3 China 212258 213766Why is table4a not tidy?

Wide data
Use pivot_longer()
pivot_longer(table4a, cols = c(`1999`, `2000`),
             names_to = "year", values_to = "cases")
# A tibble: 6 × 3
country year cases
<chr> <chr> <dbl>
1 Afghanistan 1999 745
2 Afghanistan 2000 2666
3 Brazil 1999 37737
4 Brazil 2000 80488
5 China 1999 212258
6 China 2000 213766
Long data
table2# A tibble: 12 × 4
country year type count
<chr> <dbl> <chr> <dbl>
1 Afghanistan 1999 cases 745
2 Afghanistan 1999 population 19987071
3 Afghanistan 2000 cases 2666
4 Afghanistan 2000 population 20595360
5 Brazil 1999 cases 37737
6 Brazil 1999 population 172006362
7 Brazil 2000 cases 80488
8 Brazil 2000 population 174504898
9 China 1999 cases 212258
10 China 1999 population 1272915272
11 China 2000 cases 213766
12 China 2000 population 1280428583Why is table2 not tidy?
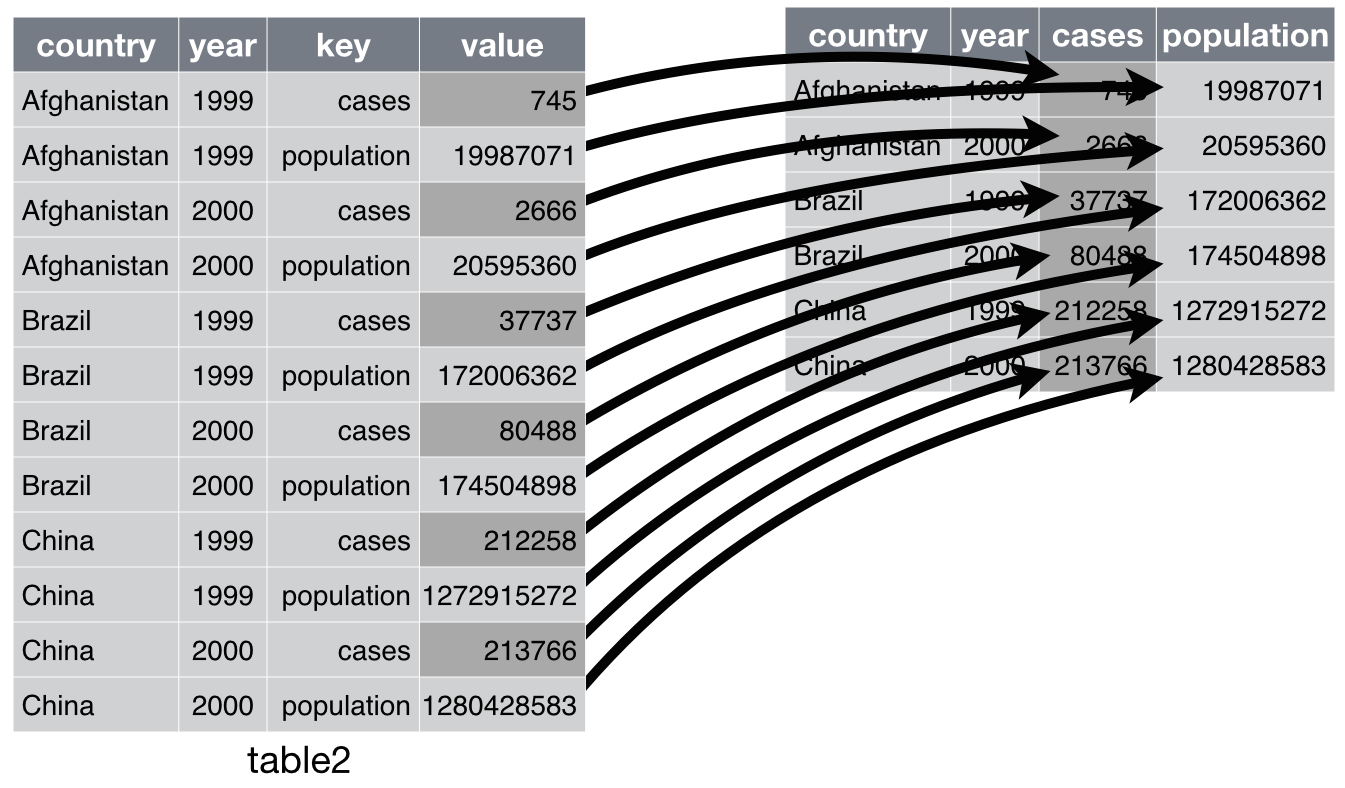
Long data
Use pivot_wider()
pivot_wider(table2, id_cols = c("country", "year"),
            names_from = type, values_from = count)
# A tibble: 6 × 4
country year cases population
<chr> <dbl> <dbl> <dbl>
1 Afghanistan 1999 745 19987071
2 Afghanistan 2000 2666 20595360
3 Brazil 1999 37737 172006362
4 Brazil 2000 80488 174504898
5 China 1999 212258 1272915272
6 China 2000 213766 1280428583