Summarizing rows
Jeff Stevens
2023-02-22
Introduction
The problem
What’s different between these data sets? What needs to happen to create data2 from data1?
data1 cond id date response
1 2 1 2022-01-07 0.29196727
2 2 2 2022-01-22 0.15475384
3 1 3 2022-01-31 0.58739265
4 3 4 2022-01-06 0.01582863
5 2 5 2022-02-12 0.83965229
6 2 6 2022-02-18 0.11944908
7 1 7 2022-02-07 0.78993001
8 3 8 2022-01-24 0.63638974
9 3 9 2022-01-09 0.99011402
10 1 10 2022-02-04 0.92637287
11 2 11 2022-02-26 0.79373441
12 3 12 2022-02-27 0.88614795data2# A tibble: 3 × 4
cond cond_n cond_mean cond_sd
<int> <int> <dbl> <dbl>
1 1 3 0.768 0.171
2 2 5 0.440 0.350
3 3 4 0.632 0.437Data wrangling
Set-up
library(dplyr)
library(nycflights13)
(flights2 <- select(flights, year:dep_delay, carrier))
# A tibble: 336,776 × 7
year month day dep_time sched_dep_time dep_delay carrier
<int> <int> <int> <int> <int> <dbl> <chr>
1 2013 1 1 517 515 2 UA
2 2013 1 1 533 529 4 UA
3 2013 1 1 542 540 2 AA
4 2013 1 1 544 545 -1 B6
5 2013 1 1 554 600 -6 DL
6 2013 1 1 554 558 -4 UA
7 2013 1 1 555 600 -5 B6
8 2013 1 1 557 600 -3 EV
9 2013 1 1 557 600 -3 B6
10 2013 1 1 558 600 -2 AA
# … with 336,766 more rowsSummarizing data
count()
flights2 |>
count(carrier)# A tibble: 16 × 2
carrier n
<chr> <int>
1 9E 18460
2 AA 32729
3 AS 714
4 B6 54635
5 DL 48110
6 EV 54173
7 F9 685
8 FL 3260
9 HA 342
10 MQ 26397
11 OO 32
12 UA 58665
13 US 20536
14 VX 5162
15 WN 12275
16 YV 601count()
flights2 |>
count(carrier, month)# A tibble: 185 × 3
carrier month n
<chr> <int> <int>
1 9E 1 1573
2 9E 2 1459
3 9E 3 1627
4 9E 4 1511
5 9E 5 1462
6 9E 6 1437
7 9E 7 1494
8 9E 8 1456
9 9E 9 1540
10 9E 10 1673
# … with 175 more rowssummarise()
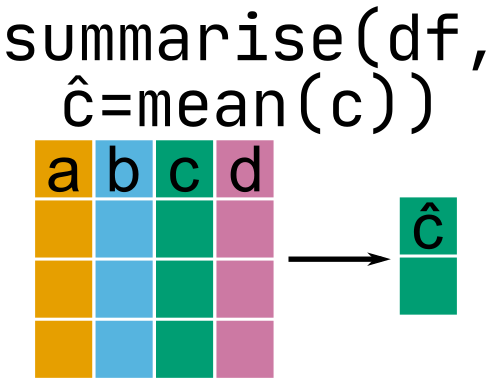
summarise()
Summary functions
summarise()
flights2 |>
summarise(mean_dep_delay = mean(dep_delay),
sd_dep_delay = sd(dep_delay),
n_dep_delay = n())# A tibble: 1 × 3
mean_dep_delay sd_dep_delay n_dep_delay
<dbl> <dbl> <int>
1 NA NA 336776Why does this return NA?
Summarizing multiple columns
How do we apply a function across multiple columns?
Summarizing multiple columns
Multiple functions (add list())
flights2 |>
summarise(across(contains("_time"), # for all columns containing "_time"
list(mean = ~ mean(.x, na.rm = TRUE), # calculate the mean
sd = ~ sd(.x, na.rm = TRUE)))) # and standard deviation# A tibble: 1 × 4
dep_time_mean dep_time_sd sched_dep_time_mean sched_dep_time_sd
<dbl> <dbl> <dbl> <dbl>
1 1349. 488. 1344. 467.Grouping data
group_by()
flights2 |>
group_by(month)# A tibble: 336,776 × 7
# Groups: month [12]
year month day dep_time sched_dep_time dep_delay carrier
<int> <int> <int> <int> <int> <dbl> <chr>
1 2013 1 1 517 515 2 UA
2 2013 1 1 533 529 4 UA
3 2013 1 1 542 540 2 AA
4 2013 1 1 544 545 -1 B6
5 2013 1 1 554 600 -6 DL
6 2013 1 1 554 558 -4 UA
7 2013 1 1 555 600 -5 B6
8 2013 1 1 557 600 -3 EV
9 2013 1 1 557 600 -3 B6
10 2013 1 1 558 600 -2 AA
# … with 336,766 more rowsgroup_by()
Remove groups with ungroup()
# A tibble: 336,776 × 7
    year month   day dep_time sched_dep_time dep_delay carrier
   <int> <int> <int>    <int>          <int>     <dbl> <chr>
 1  2013     1     1      517            515         2 UA
 2  2013     1     1      533            529         4 UA
 3  2013     1     1      542            540         2 AA
 4  2013     1     1      544            545        -1 B6
 5  2013     1     1      554            600        -6 DL
 6  2013     1     1      554            558        -4 UA
 7  2013     1     1      555            600        -5 B6
 8  2013     1     1      557            600        -3 EV
 9  2013     1     1      557            600        -3 B6
10  2013     1     1      558            600        -2 AA
# … with 336,766 more rows
Summarizing groups of data
flights2 |>
  group_by(carrier) |>
  summarise(carrier_n = n(),
            mean_carrier_delay = mean(dep_delay, na.rm = TRUE),
            sd_carrier_delay = sd(dep_delay, na.rm = TRUE))
# A tibble: 16 × 4
carrier carrier_n mean_carrier_delay sd_carrier_delay
<chr> <int> <dbl> <dbl>
1 9E 18460 16.7 45.9
2 AA 32729 8.59 37.4
3 AS 714 5.80 31.4
4 B6 54635 13.0 38.5
5 DL 48110 9.26 39.7
6 EV 54173 20.0 46.6
7 F9 685 20.2 58.4
8 FL 3260 18.7 52.7
9 HA 342 4.90 74.1
10 MQ 26397 10.6 39.2
11 OO 32 12.6 43.1
12 UA 58665 12.1 35.7
13 US 20536 3.78 28.1
14 VX 5162 12.9 44.8
15 WN 12275 17.7 43.3
16 YV 601 19.0 49.2Summarizing multiple groups
flights2 |>
  group_by(carrier, month) |>
  summarise(carrier_n = n(),
            mean_carrier_delay = mean(dep_delay, na.rm = TRUE),
            sd_carrier_delay = sd(dep_delay, na.rm = TRUE))
# A tibble: 185 × 5
# Groups: carrier [16]
carrier month carrier_n mean_carrier_delay sd_carrier_delay
<chr> <int> <int> <dbl> <dbl>
1 9E 1 1573 16.9 47.6
2 9E 2 1459 16.5 50.5
3 9E 3 1627 13.4 43.0
4 9E 4 1511 13.6 43.8
5 9E 5 1462 22.7 50.6
6 9E 6 1437 29.0 55.4
7 9E 7 1494 31.4 60.4
8 9E 8 1456 17.3 42.8
9 9E 9 1540 7.75 34.3
10 9E 10 1673 9.33 33.8
# … with 175 more rowsSummarizing groups for multiple columns
group_by() + summarise() + across()
flights2 |>
  group_by(carrier) |> # separately for each carrier
  summarise(across(contains("_time"), # for all columns containing "_time"
                   list(mean = ~ mean(.x, na.rm = TRUE), # calculate the mean
                        sd = ~ sd(.x, na.rm = TRUE)))) # and standard deviation
# A tibble: 16 × 5
carrier dep_time_mean dep_time_sd sched_dep_time_mean sched_dep_time_sd
<chr> <dbl> <dbl> <dbl> <dbl>
1 9E 1487. 450. 1472. 430.
2 AA 1297. 458. 1290. 442.
3 AS 1295. 566. 1285. 552.
4 B6 1381. 555. 1397. 525.
5 DL 1351. 463. 1346. 445.
6 EV 1369. 497. 1354. 471.
7 F9 1438. 405. 1408. 376.
8 FL 1387. 480. 1372. 446.
9 HA 949. 53.6 974. 41.7
10 MQ 1393. 442. 1387. 428.
11 OO 1725. 163. 1731. 162.
12 UA 1327. 484. 1313. 467.
13 US 1231. 456. 1246. 447.
14 VX 1280. 460. 1265. 435.
15 WN 1281. 468. 1260. 440.
16 YV 1601. 245. 1575. 223. Solving the problem
What code turns data1 into data2?
data1 cond id date response
1 2 1 2022-01-07 0.29196727
2 2 2 2022-01-22 0.15475384
3 1 3 2022-01-31 0.58739265
4 3 4 2022-01-06 0.01582863
5 2 5 2022-02-12 0.83965229
6 2 6 2022-02-18 0.11944908
7 1 7 2022-02-07 0.78993001
8 3 8 2022-01-24 0.63638974
9 3 9 2022-01-09 0.99011402
10 1 10 2022-02-04 0.92637287
11 2 11 2022-02-26 0.79373441
12 3 12 2022-02-27 0.88614795data2# A tibble: 3 × 4
cond cond_n cond_mean cond_sd
<int> <int> <dbl> <dbl>
1 1 3 0.768 0.171
2 2 5 0.440 0.350
3 3 4 0.632 0.437Slicing data
Slicing rows
What if you want to grab a subset of rows per group?
dplyr::slice_() functions
-
slice_head()first row(s) from each group -
slice_tail()last row(s) in each group -
slice_min()row(s) with smallest value in column x -
slice_max()row(s) with largest value in column x -
slice_sample()random row(s)
Slicing rows
Let’s say we want the first flight for each carrier on 2022-02-22.
flights2 |>
  filter(month == 2 & day == 22 & dep_time > 10)
# A tibble: 938 × 7
year month day dep_time sched_dep_time dep_delay carrier
<int> <int> <int> <int> <int> <dbl> <chr>
1 2013 2 22 455 500 -5 US
2 2013 2 22 512 515 -3 UA
3 2013 2 22 530 530 0 UA
4 2013 2 22 536 545 -9 B6
5 2013 2 22 539 540 -1 AA
6 2013 2 22 551 600 -9 B6
7 2013 2 22 553 600 -7 DL
8 2013 2 22 553 600 -7 EV
9 2013 2 22 553 600 -7 B6
10 2013 2 22 553 600 -7 US
# … with 928 more rowsSlicing rows
Let’s say we want the first flight for each carrier on 2022-02-22.
flights2 |>
  filter(month == 2 & day == 22 & dep_time > 10) |>
  group_by(carrier) |>
  slice_min(dep_time)
# A tibble: 15 × 7
# Groups: carrier [15]
year month day dep_time sched_dep_time dep_delay carrier
<int> <int> <int> <int> <int> <dbl> <chr>
1 2013 2 22 558 605 -7 9E
2 2013 2 22 539 540 -1 AA
3 2013 2 22 731 725 6 AS
4 2013 2 22 536 545 -9 B6
5 2013 2 22 553 600 -7 DL
6 2013 2 22 553 600 -7 EV
7 2013 2 22 827 830 -3 F9
8 2013 2 22 602 600 2 FL
9 2013 2 22 857 900 -3 HA
10 2013 2 22 553 600 -7 MQ
11 2013 2 22 512 515 -3 UA
12 2013 2 22 455 500 -5 US
13 2013 2 22 702 705 -3 VX
14 2013 2 22 601 600 1 WN
15 2013 2 22 1601 1606 -5 YV Slicing rows
What if we want the three most delayed flight for each carrier on 2022-02-22.
flights2 |>
  filter(month == 2 & day == 22 & dep_time > 10) |>
  group_by(carrier) |>
  slice_max(dep_delay, n = 3) |>
  arrange(carrier, dep_delay)
# A tibble: 43 × 7
# Groups: carrier [15]
year month day dep_time sched_dep_time dep_delay carrier
<int> <int> <int> <int> <int> <dbl> <chr>
1 2013 2 22 1723 1540 103 9E
2 2013 2 22 2301 1945 196 9E
3 2013 2 22 2010 1550 260 9E
4 2013 2 22 2134 2015 79 AA
5 2013 2 22 2240 2045 115 AA
6 2013 2 22 2000 1700 180 AA
7 2013 2 22 1811 1815 -4 AS
8 2013 2 22 731 725 6 AS
9 2013 2 22 1955 1805 110 B6
10 2013 2 22 1829 1600 149 B6
# … with 33 more rowsPutting it all together
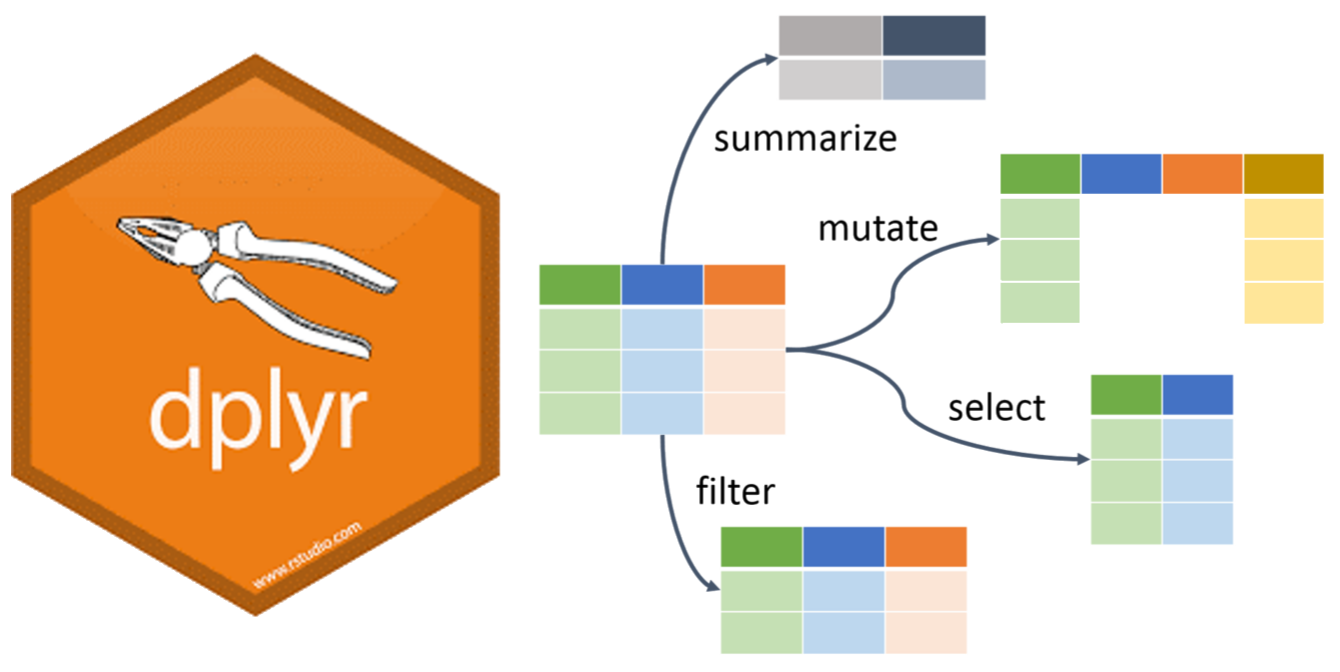
{dplyr} verbs
Solving the problem
What code turns data1 into data3?
data1 cond id date response
1 2 1 2022-01-07 0.29196727
2 2 2 2022-01-22 0.15475384
3 1 3 2022-01-31 0.58739265
4 3 4 2022-01-06 0.01582863
5 2 5 2022-02-12 0.83965229
6 2 6 2022-02-18 0.11944908
7 1 7 2022-02-07 0.78993001
8 3 8 2022-01-24 0.63638974
9 3 9 2022-01-09 0.99011402
10 1 10 2022-02-04 0.92637287
11 2 11 2022-02-26 0.79373441
12 3 12 2022-02-27 0.88614795data3# A tibble: 2 × 2
condition earliest_date
<chr> <date>
1 Condition 2 2022-01-07
2 Condition 3 2022-01-06